2021 Market FAQ
By Ehren StanhopeMay 2021
OSAM Client Portfolio Manager, Ehren Stanhope, shares our views on frequently asked questions we’ve received from clients and allocators throughout this eventful start to 2021. We hope you find this public Q&A informative. If you do not currently read Ehren’s daily note, you can start following it here: @FactorInvestor.
1. What themes most affected the markets in the first quarter?
What a wacky quarter... an inauguration, fiscal stimulus, a storming of the U.S. Capitol, SPAC's, fund failures, YOLO derivative-fueled stock trades, yields doubling, big tech's fall from grace, the emergence of value and small cap, and waiting for each pronouncement from Central Bankers and Health Officials with bated breath.
Reflation stood atop the mountainous wall of worry that was the beginning of 2021 and foisted equity markets up and over. Re-opening stocks soared while stay-at-home's lagged. Inflation metrics really started to heat up.
The S&P 500 finished up roughly 6.2% on the quarter. The Tech-heavy Nasdaq came in around 2.8%, and the small cap Russell 2000 clocked an impressive 12.8%. The dollar surged 3.6%. While oil was up 36% at one point in the quarter—stoking inflation concerns. Oil finished Q1 "just" 22% higher. Energy stocks soared nearly 30% in sympathy. The US 10-year Treasury yield went from 0.9% to 1.7% in a massive bear steepener, the likes of which have not been seen for over a decade. It is easy to forget that we are technically still in a recession that started in February 2020.
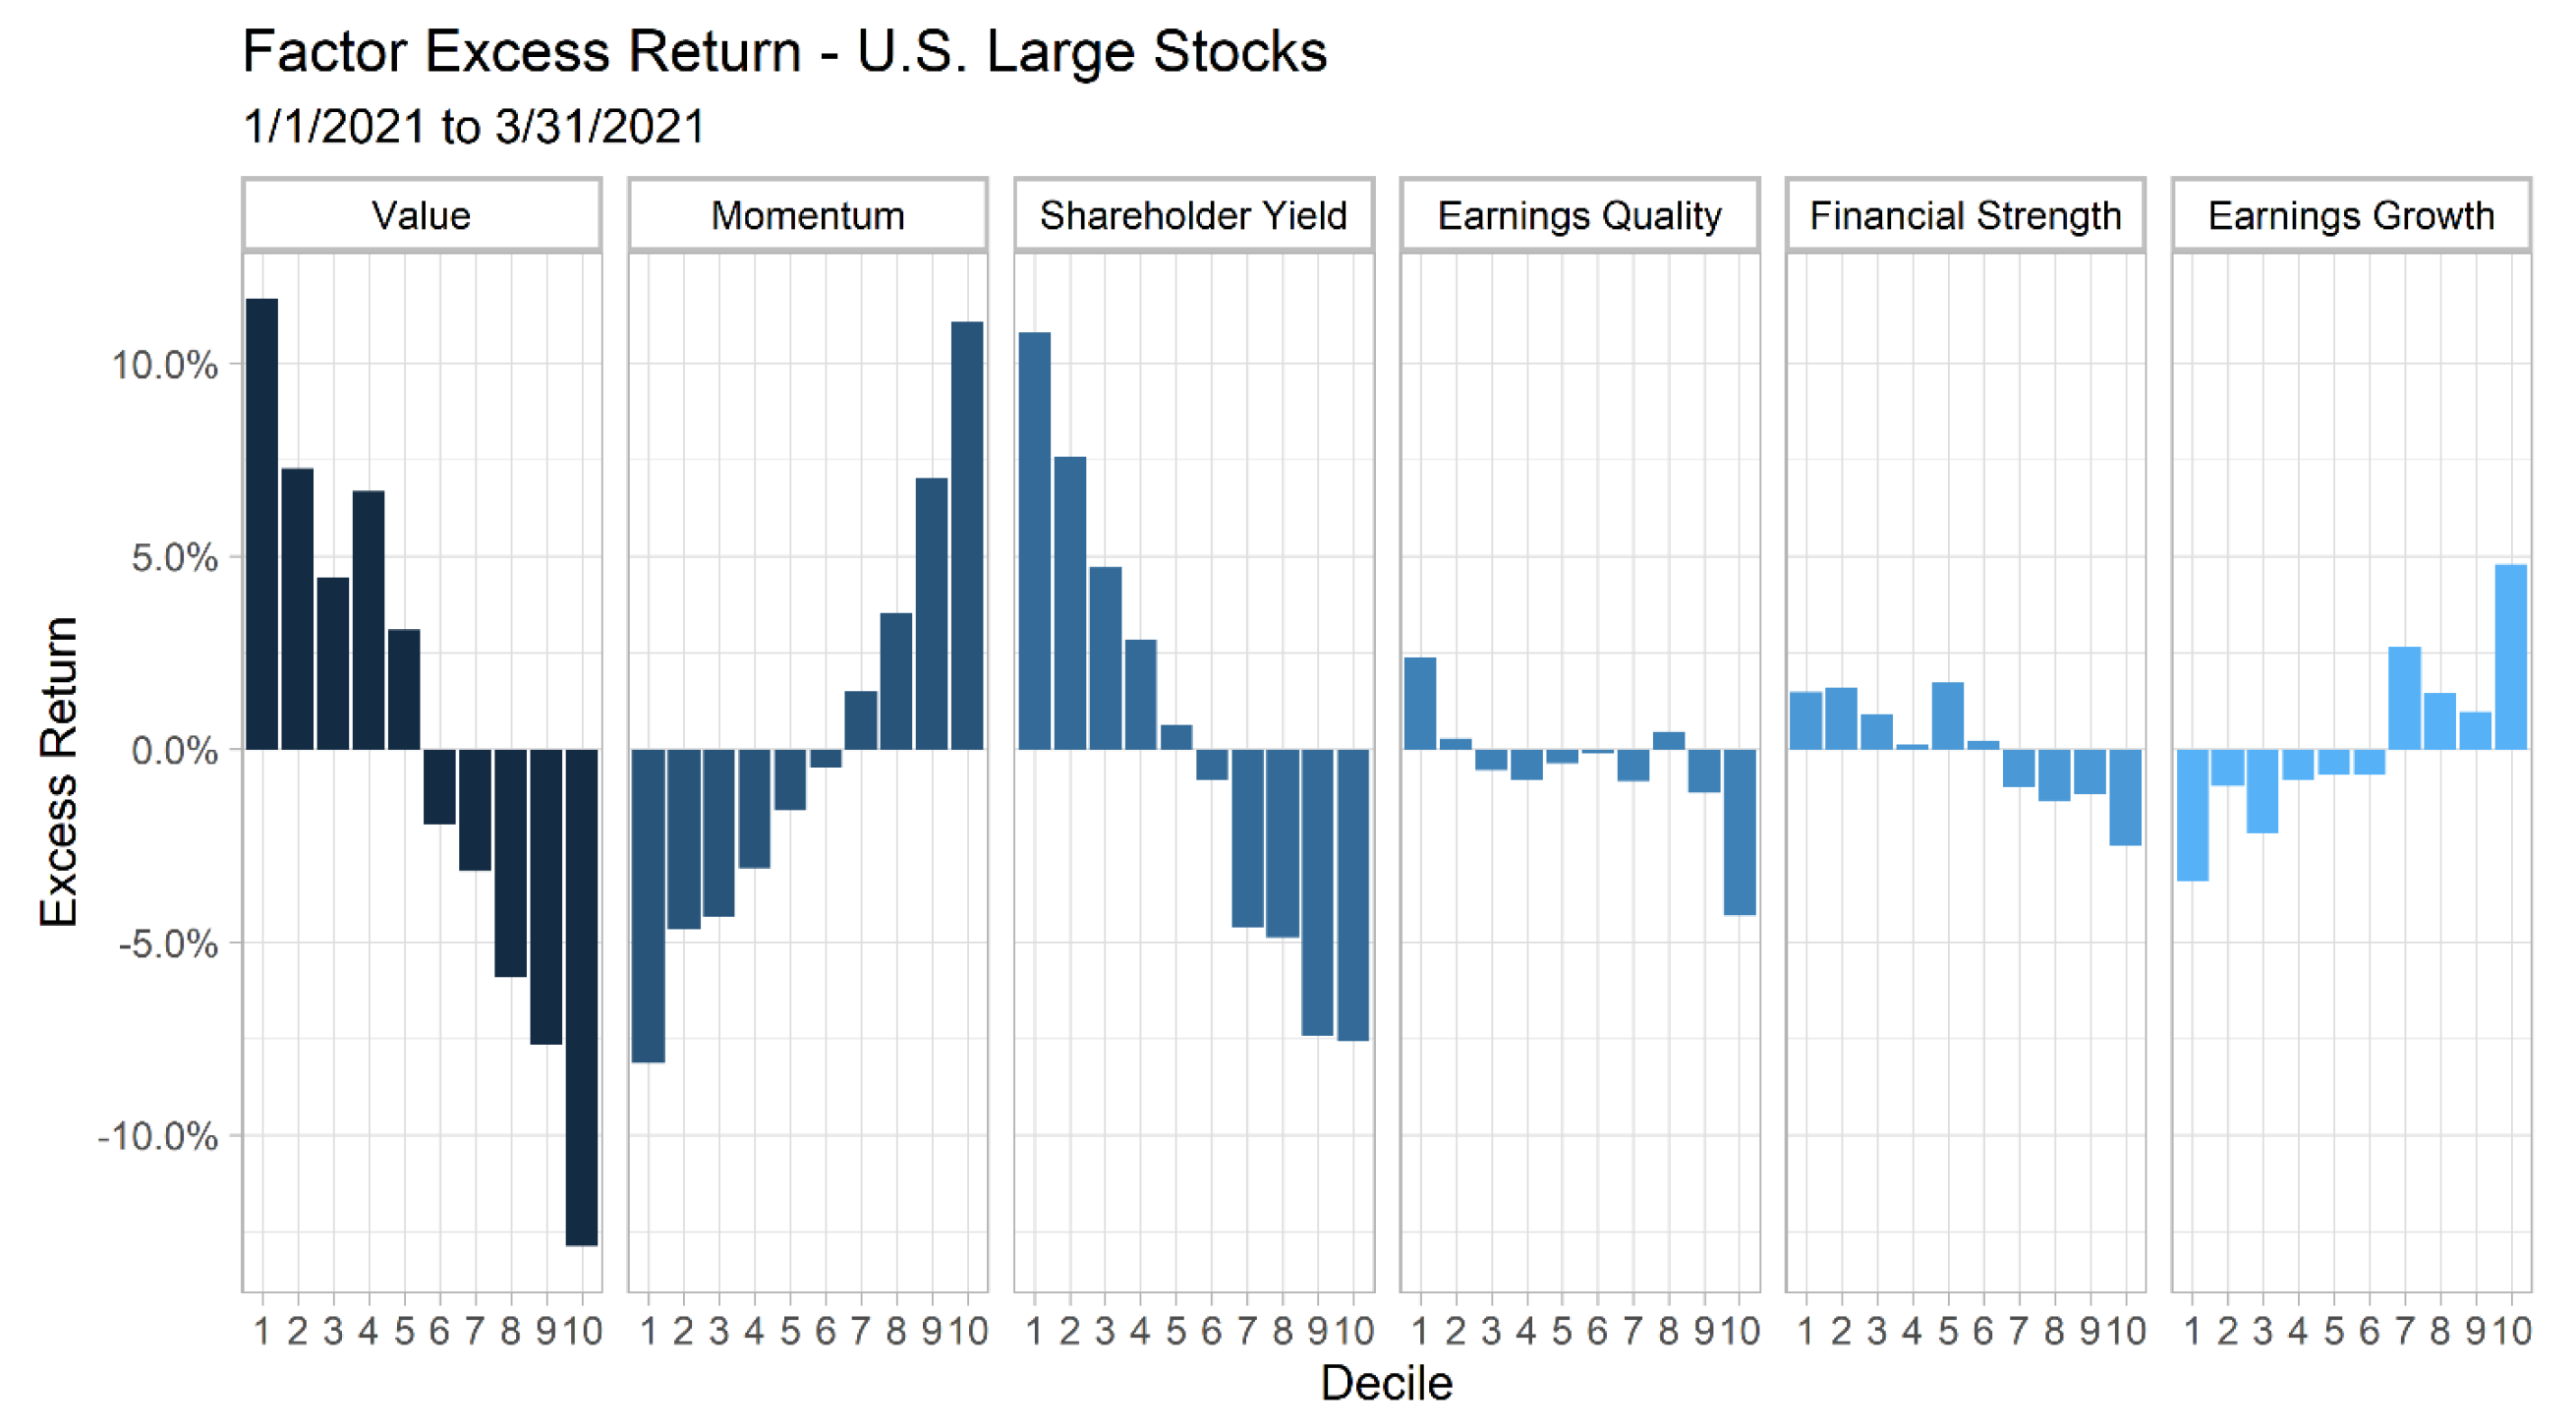
Value eviscerated growth to the fanfare of many asset allocators – except Ark Invest. Momentum inverted while quality continued its attempt to re-orient itself from the pandemic inversions (poor quality outperforming high quality).
2. What do you expect from the Fed on the monetary policy front and where do you see rates heading?
The short answer is “who knows”. We do not try to predict rate movements in our investment process. Many have tried; few have succeeded. Yes, rates matter, but only to the extent that they impact earnings and cash flows. Rates may rise, but corporations have varying debt maturities and may not be impacted immediately and/or may have multiple years to adjust their balance sheet for the given rate environment. Though we do not speak to management teams as part of our investment process, we have seen examples of otherwise strained companies refinancing their debt last year to give themselves multiple years of runway to operate.
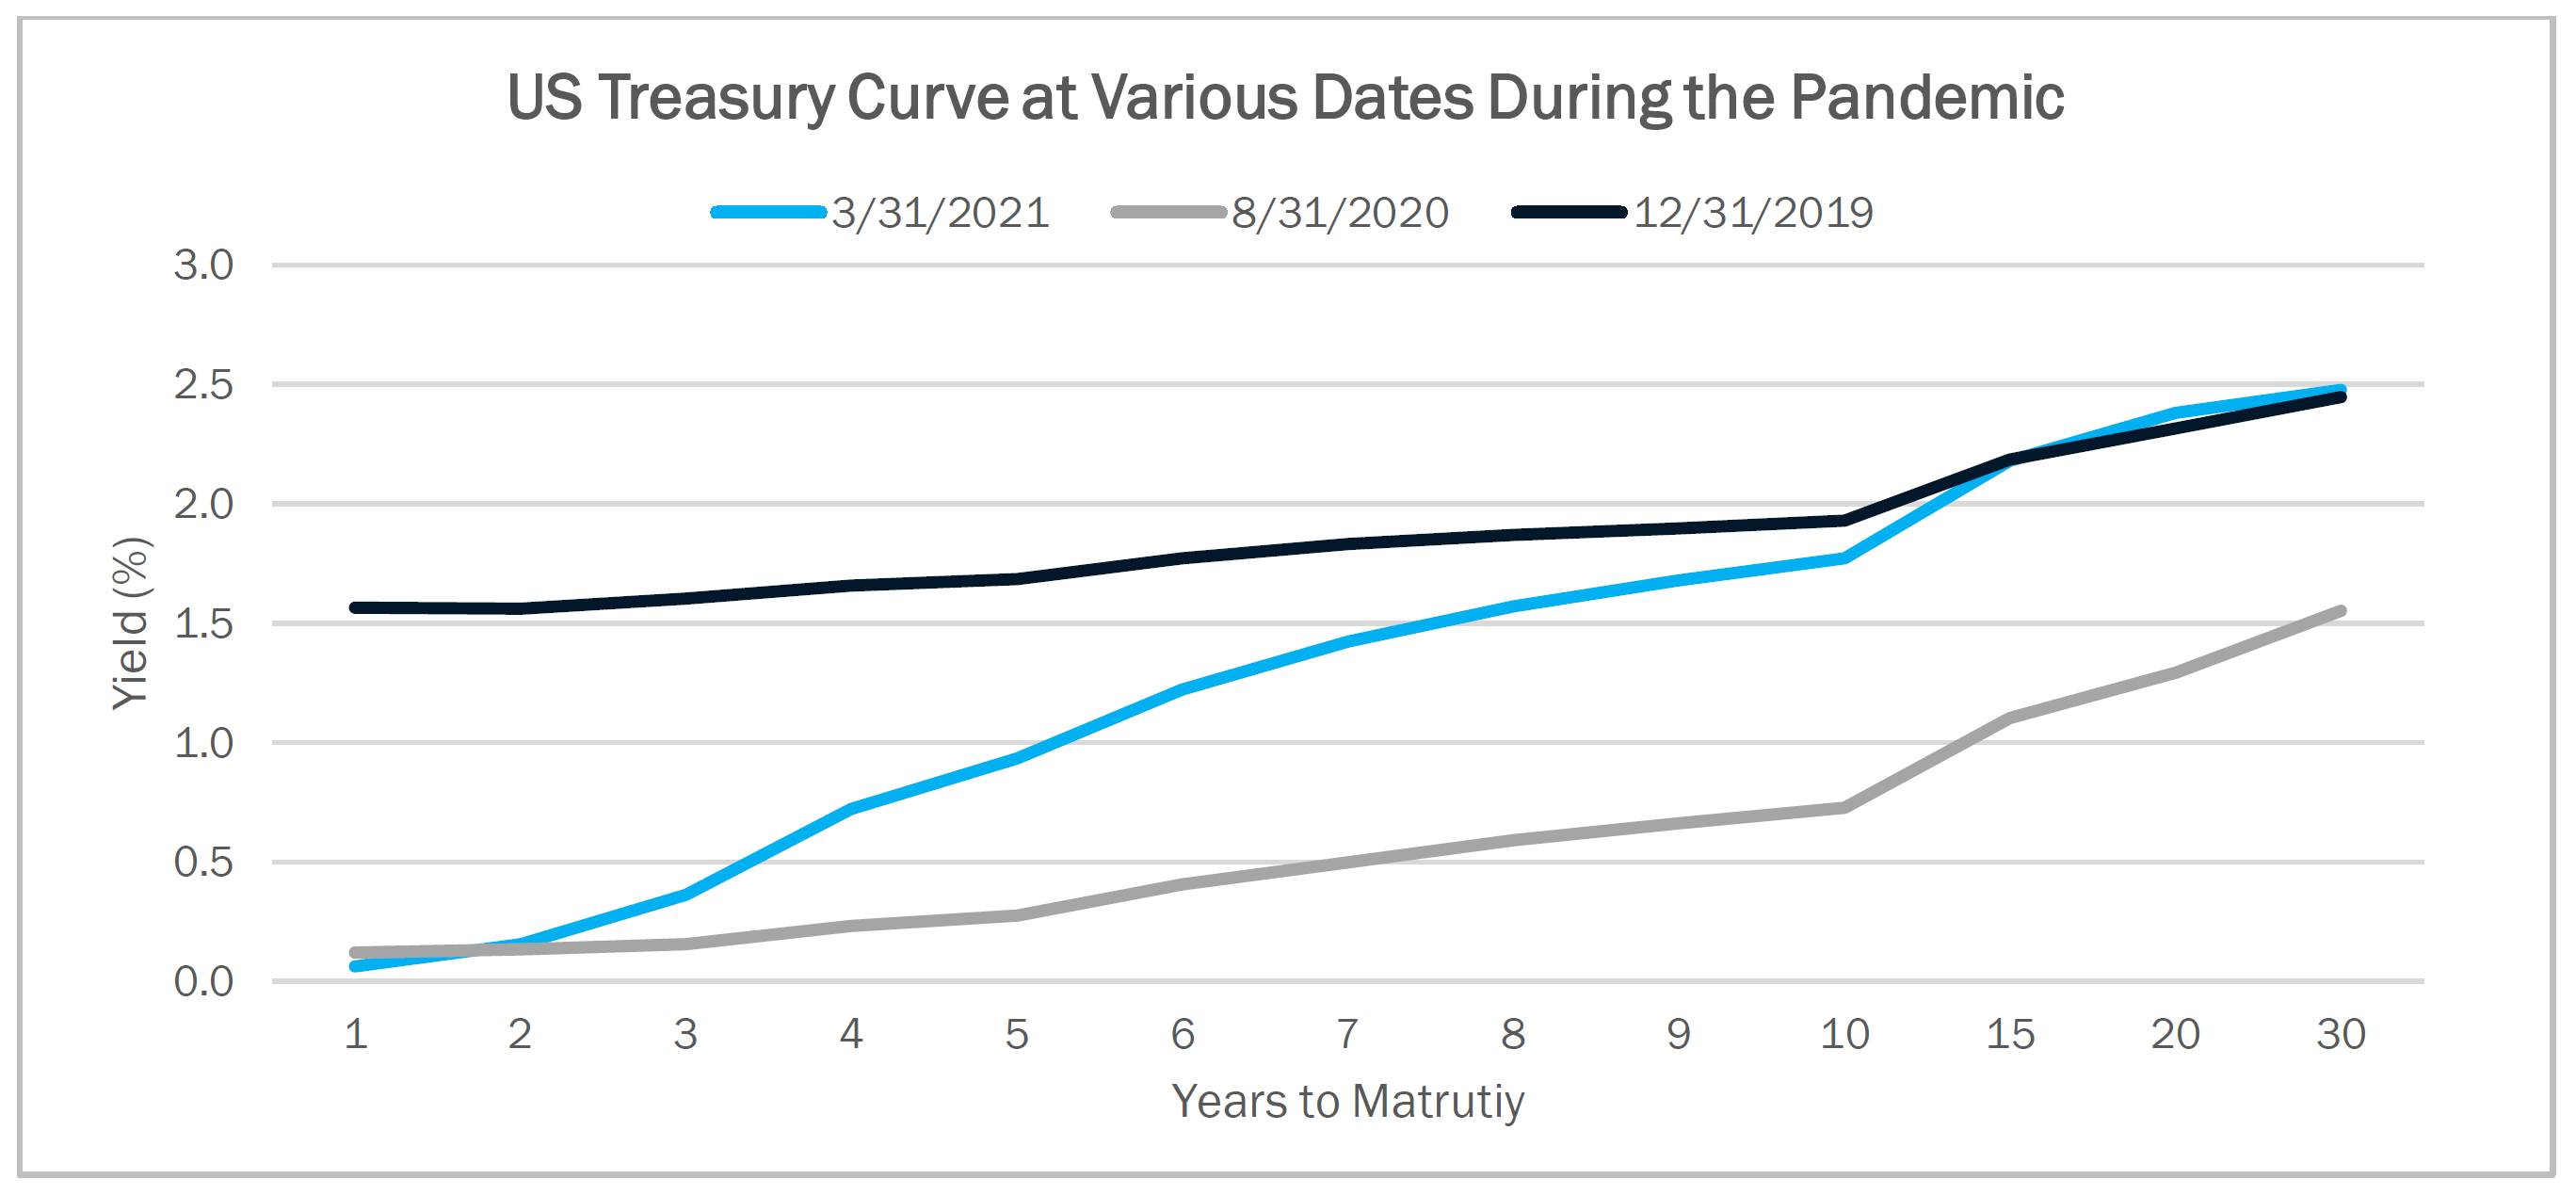
It is also important to think of interest rates on a spectrum. Below is a chart of the U.S. yield curve as of 12/31/2019 (pre-pandemic), at 8/31/2020 (mega cap growth’s heyday and peak deflation sentiment), and the end of the first quarter of 2021. Note that short rates are much lower than pre-pandemic levels, but long rates are no different. Long rates were also extremely low during the malaise of late summer 2020 but have risen as inflation expectations increased.
This occurs because the Federal Open Market Committee (FOMC) controls short-term interest rates. In a Quantitative Easing (QE) environment, they are technically exerting control over longer maturities, but for the most part, ten years and out on the yield curve is a fixed income sector controlled by market forces. Long and short rates have different drivers so even though the Fed may raise short-term rates, that does not necessarily mean corporate borrowing rates and or mortgage rates — the rates most important to the real economy — will increase.
The Fed has done a reasonable job of threading the needle during the COVID crisis. They averted a lock up of the financial system in March 2020 and provided consistent support until the stimulus baton was handed off to the Fiscal side of the house.
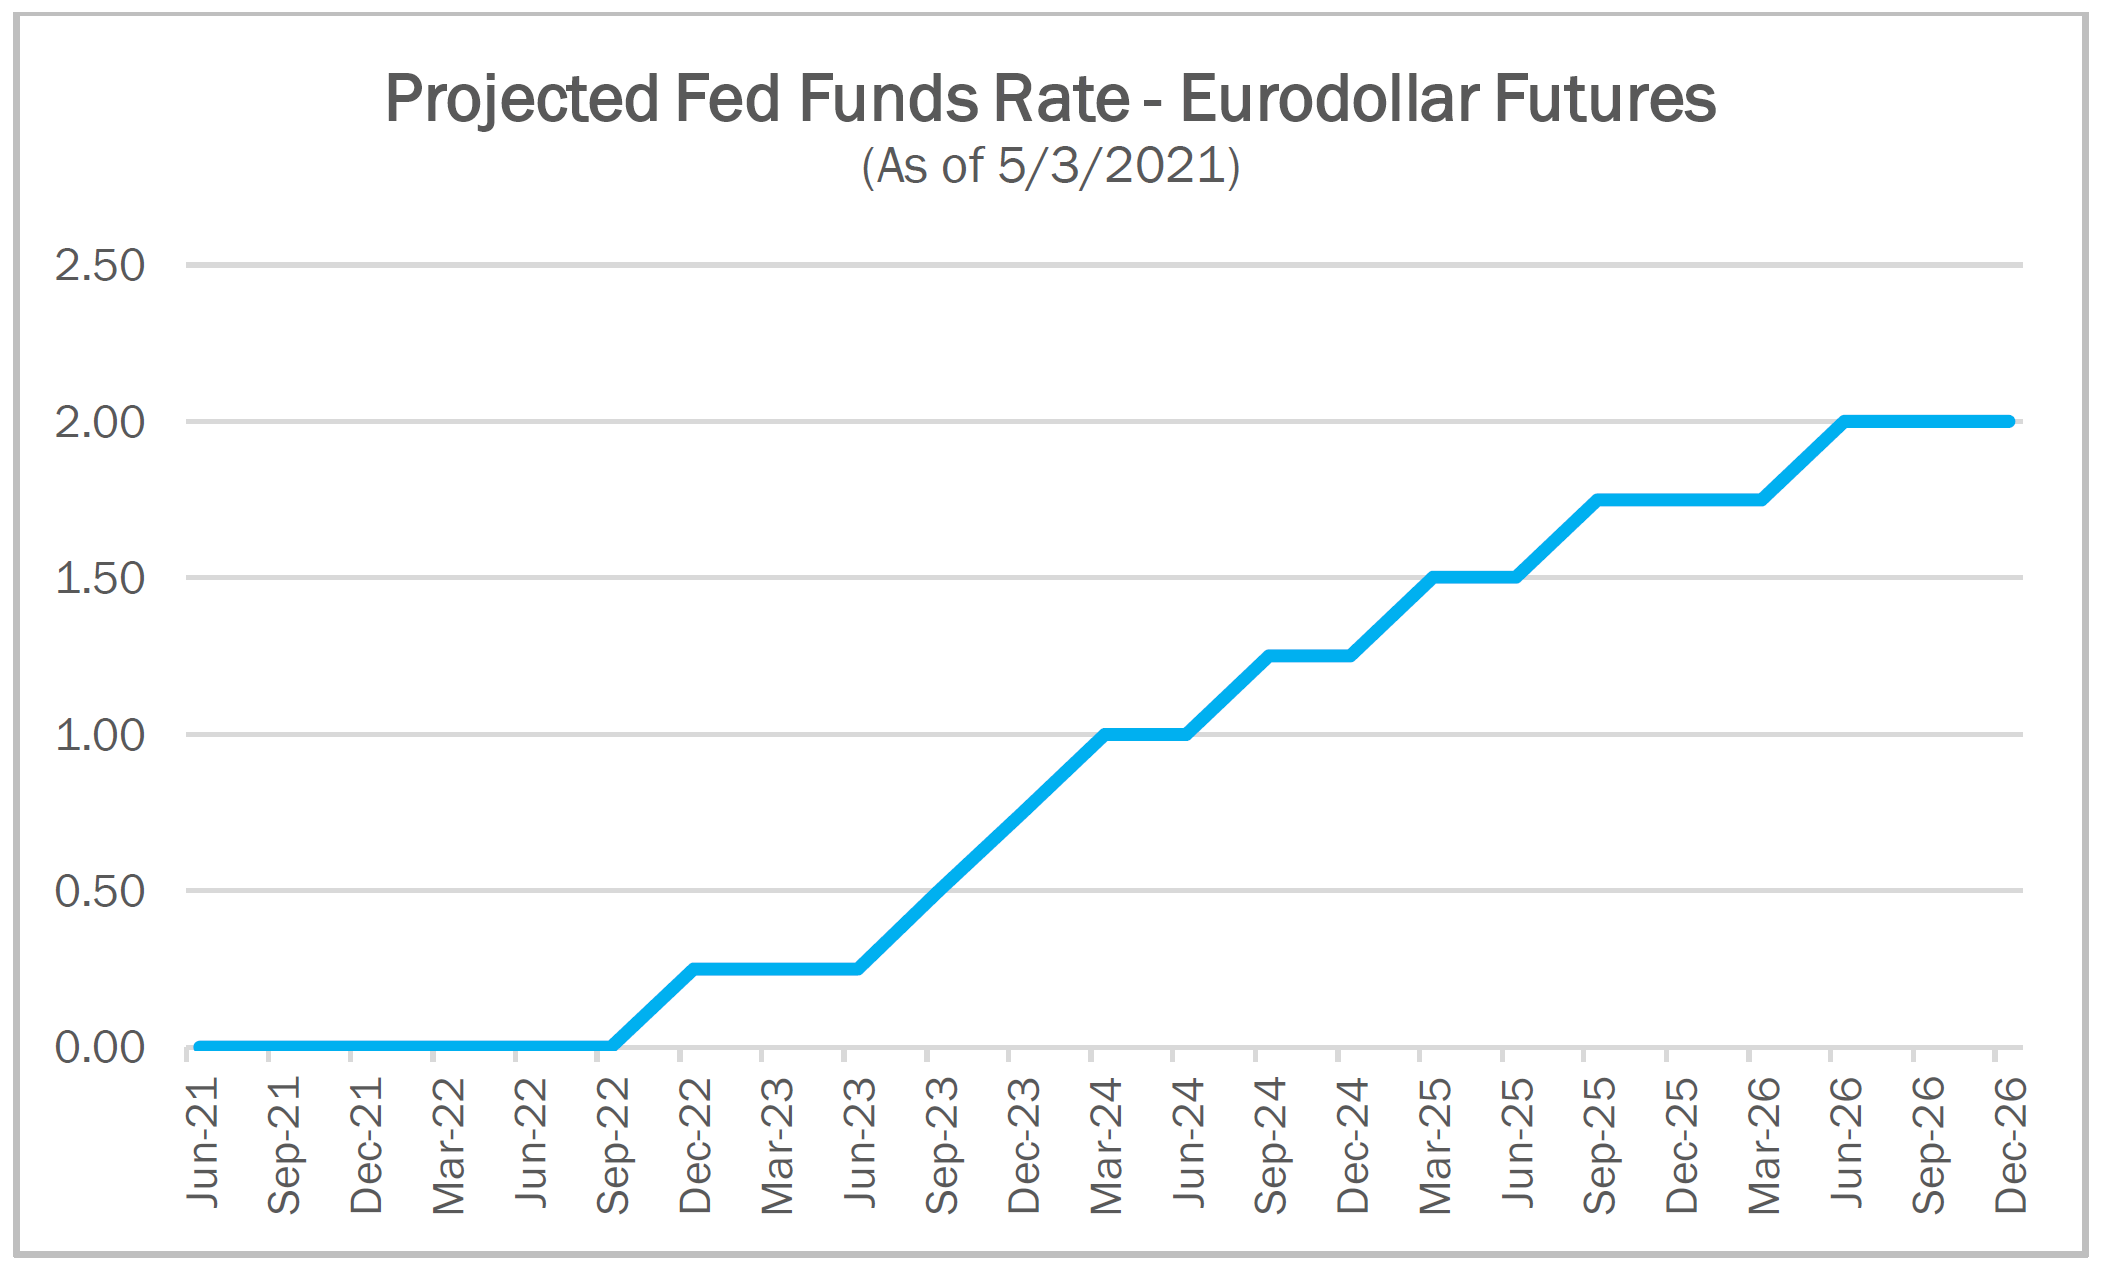
The Fed will now look to withdrawing its stimulus through highly choreographed communications via Fed speeches and FOMC meetings. In advance of the first hike, it is anticipated that the monthly $120 billion QE purchases will gradually be reduced — a process commonly referred to as “Tapering”. Currently, the expectation baked into short-term market-based interest rate futures is for a 0.25% hike in Q4 2022 and rising to 2% by mid-2026. Market participants are much more hawkish than the Fed has communicated thus far, largely believing inflation will prove to run hotter than the Fed will ultimately be comfortable with.
3. How much more fiscal stimulus do we expect to see and when?
Fiscal stimulus has kicked into high gear. The final stimulus dollar amount will not be known until the ink is dry, but it’s safe to say they are coming out in rapid succession and are well in excess of the New Deal and Global Financial Crisis (GFC) stimulus programs.
The White House basically has a limited number of shots each year via budget reconciliation, which enables a simple majority for passing controversial agenda items. Fiscal stimulus is morphing, however. The first few rounds were direct transfers from the Federal government to taxpayers. The most recent Biden proposals have included tax increases on corporations and high-income individuals. Most notably as it relates to capital markets — a proposed equalization of capital gains and income taxes.
4. As it relates to the stimulus, what are the longer-term implications? National debt, budget deficits, taxes, will we see negative rates on government bonds?
Fiscal stimulus is a tricky instrument. It can directly inject funds into the economy — stimulus checks — but to some extent this is borrowing from the future to pay for current needs. U.S. debt to GDP is now as high as it was in the post-WWII era. The recovery from that period is instructive. However, sovereign entities rarely repay their debts. Rather, the debt simply gets rolled forward — kicking the can down the road. How do they do this? Inflation.
The post-WWII recovery led to massive inflation that peaked decades later in the early 1980’s. Since the rate of nominal economic growth exceeded interest rates on debt, the U.S. inflated its way out of a massive debt burden. Historically, this is very common. Currency depreciation offers another method for crawling out from the cave of sovereign debt. When experienced in extremis, high inflation and currency depreciation carry their own set of problems, but can be quite effective in moderation.
The Fed and Treasury are keenly aware of how rates impact wealth, income, corporate earnings, fixed investment, and liquidity. The last thing they want are skyrocketing rates. As many have mentioned, the interest on Treasury debt as a proportion of the fiscal budget would sky-rocket. Given the amount of leverage in the global financial system, such an event is untenable and would be avoided at all costs. That doesn’t mean we might not see 3, 4, 5% inflation, but the double-digit inflation of the 1970’s seems unlikely.
5. What should investors anticipate in the nearer term 12 months?
We are big believers in the long-term efficacy of value and shareholder yield (the combination of dividends and share buybacks). These two factors are benefitting from the reflation trade and appear to have much further to run if there are no major setbacks with the vaccine rollout.
International markets have lagged in the rollout and not participated in the reflation trade to the same extent. Historically, U.S. and International equity markets tend to outperform each other in long cyclical waves, with the prior period of International outperformance concluding with the GFC. Since then, the U.S. has outperformed substantially. It would not surprise us if International equity markets began catching up — assuming global vaccinations ramped up.
Expectations for mega cap growth are exceptionally high. Near year end, the gap in long-term earnings growth expectations for the Russell 1000 Growth and Value indexes was 18% (in favor of growth). That is a massive spread, and a historical high since long-term growth estimates have been tracked, which places very high expectations on growth companies. Disappointments in fundamentals versus expectations could be a headwind.
Overall, it seems likely that Monetary and Fiscal stimulus will continue to dominate the narrative and could invite some volatility — tapering, overshoots from transitory inflation, rate hikes, tax increases, etc.
GENERAL LEGAL DISCLOSURES & HYPOTHETICAL AND/OR BACKTESTED RESULTS DISCLAIMER
The material contained herein is intended as a general market commentary. Opinions expressed herein are solely those of O’Shaughnessy Asset Management, LLC and may differ from those of your broker or investment firm.
Please remember that past performance may not be indicative of future results. Different types of investments involve varying degrees of risk, and there can be no assurance that the future performance of any specific investment, investment strategy, or product (including the investments and/or investment strategies recommended or undertaken by O’Shaughnessy Asset Management, LLC), or any non-investment related content, made reference to directly or indirectly in this piece will be profitable, equal any corresponding indicated historical performance level(s), be suitable for your portfolio or individual situation, or prove successful. Due to various factors, including changing market conditions and/or applicable laws, the content may no longer be reflective of current opinions or positions. Moreover, you should not assume that any discussion or information contained in this piece serves as the receipt of, or as a substitute for, personalized investment advice from O’Shaughnessy Asset Management, LLC. Any individual account performance information reflects the reinvestment of dividends (to the extent applicable), and is net of applicable transaction fees, O’Shaughnessy Asset Management, LLC’s investment management fee (if debited directly from the account), and any other related account expenses. Account information has been compiled solely by O’Shaughnessy Asset Management, LLC, has not been independently verified, and does not reflect the impact of taxes on non-qualified accounts. In preparing this report, O’Shaughnessy Asset Management, LLC has relied upon information provided by the account custodian. Please defer to formal tax documents received from the account custodian for cost basis and tax reporting purposes. Please remember to contact O’Shaughnessy Asset Management, LLC, in writing, if there are any changes in your personal/financial situation or investment objectives for the purpose of reviewing/evaluating/revising our previous recommendations and/or services, or if you want to impose, add, or modify any reasonable restrictions to our investment advisory services. Please Note: Unless you advise, in writing, to the contrary, we will assume that there are no restrictions on our services, other than to manage the account in accordance with your designated investment objective. Please Also Note: Please compare this statement with account statements received from the account custodian. The account custodian does not verify the accuracy of the advisory fee calculation. Please advise us if you have not been receiving monthly statements from the account custodian. Historical performance results for investment indices and/or categories have been provided for general comparison purposes only, and generally do not reflect the deduction of transaction and/or custodial charges, the deduction of an investment management fee, nor the impact of taxes, the incurrence of which would have the effect of decreasing historical performance results. It should not be assumed that your account holdings correspond directly to any comparative indices. To the extent that a reader has any questions regarding the applicability of any specific issue discussed above to his/her individual situation, he/she is encouraged to consult with the professional advisor of his/her choosing. O’Shaughnessy Asset Management, LLC is neither a law firm nor a certified public accounting firm and no portion of the newsletter content should be construed as legal or accounting advice. A copy of the O’Shaughnessy Asset Management, LLC’s current written disclosure statement discussing our advisory services and fees is available upon request
The risk-free rate used in the calculation of Sortino, Sharpe, and Treynor ratios is 5%, consistently applied across time
The universe of All Stocks consists of all securities in the Chicago Research in Security Prices (CRSP) dataset or S&P Compustat Database (or other, as noted) with inflation-adjusted market capitalization greater than $200 million as of most recent year-end. The universe of Large Stocks consists of all securities in the Chicago Research in Security Prices (CRSP) dataset or S&P Compustat Database (or other, as noted) with inflation-adjusted market capitalization greater than the universe average as of most recent year-end. The stocks are equally weighted and generally rebalanced annually
Hypothetical performance results shown on the preceding pages are backtested and do not represent the performance of any account managed by OSAM, but were achieved by means of the retroactive application of each of the previously referenced models, certain aspects of which may have been designed with the benefit of hindsight
The hypothetical backtested performance does not represent the results of actual trading using client assets nor decision-making during the period and does not and is not intended to indicate the past performance or future performance of any account or investment strategy managed by OSAM. If actual accounts had been managed throughout the period, ongoing research might have resulted in changes to the strategy which might have altered returns. The performance of any account or investment strategy managed by OSAM will differ from the hypothetical backtested performance results for each factor shown herein for a number of reasons, including without limitation the following:
- Although OSAM may consider from time to time one or more of the factors noted herein in managing any account, it may not consider all or any of such factors. OSAM may (and will) from time to time consider factors in addition to those noted herein in managing any account.
- OSAM may rebalance an account more frequently or less frequently than annually and at times other than presented herein.
- OSAM may from time to time manage an account by using non-quantitative, subjective investment management methodologies in conjunction with the application of factors.
- The hypothetical backtested performance results assume full investment, whereas an account managed by OSAM may have a positive cash position upon rebalance. Had the hypothetical backtested performance results included a positive cash position, the results would have been different and generally would have been lower.
- The hypothetical backtested performance results for each factor do not reflect any transaction costs of buying and selling securities, investment management fees (including without limitation management fees and performance fees), custody and other costs, or taxes – all of which would be incurred by an investor in any account managed by OSAM. If such costs and fees were reflected, the hypothetical backtested performance results would be lower.
- The hypothetical performance does not reflect the reinvestment of dividends and distributions therefrom, interest, capital gains and withholding taxes.
- Accounts managed by OSAM are subject to additions and redemptions of assets under management, which may positively or negatively affect performance depending generally upon the timing of such events in relation to the market’s direction.
- Simulated returns may be dependent on the market and economic conditions that existed during the period. Future market or economic conditions can adversely affect the returns.
Please Note: Socially Responsible Investing Limitations. Socially Responsible Investing involves the incorporation of Environmental, Social and Governance considerations into the investment due diligence process (“ESG). There are potential limitations associated with allocating a portion of an investment portfolio in ESG securities (i.e., securities that have a mandate to avoid, when possible, investments in such products as alcohol, tobacco, firearms, oil drilling, gambling, etc.). The number of these securities may be limited when compared to those that do not maintain such a mandate. ESG securities could underperform broad market indices. Investors must accept these limitations, including potential for underperformance. Correspondingly, the number of ESG mutual funds and exchange traded funds are few when compared to those that do not maintain such a mandate. As with any type of investment (including any investment and/or investment strategies recommended and/or undertaken by OSAM), there can be no assurance that investment in ESG securities or funds will be profitable, or prove successful.