Canvas Q1 Commentary
By OSAM Research TeamApril 2022
Key Points:
- Equities gave back some of their 2021 calendar year gains as the FOMC’s hawkish pivot, the Russia-Ukraine conflict, and China’s zero-COVID lockdowns all weighed on markets.
- Value and Shareholder Yield outperformed across all universes. Momentum was generally flat versus the broad market. Quality was notably important in the equity market drawdown through mid-March.
- Lower market cap stocks generally underperformed on the quarter and year across universes, which was a headwind for factor allocations relative to cap-weighted indexes.
- Stocks ranking highly on our Stability theme—stability in sales, earnings, share issuance, and price volatility—generally outperformed for the quarter and particularly during the market drawdown period.
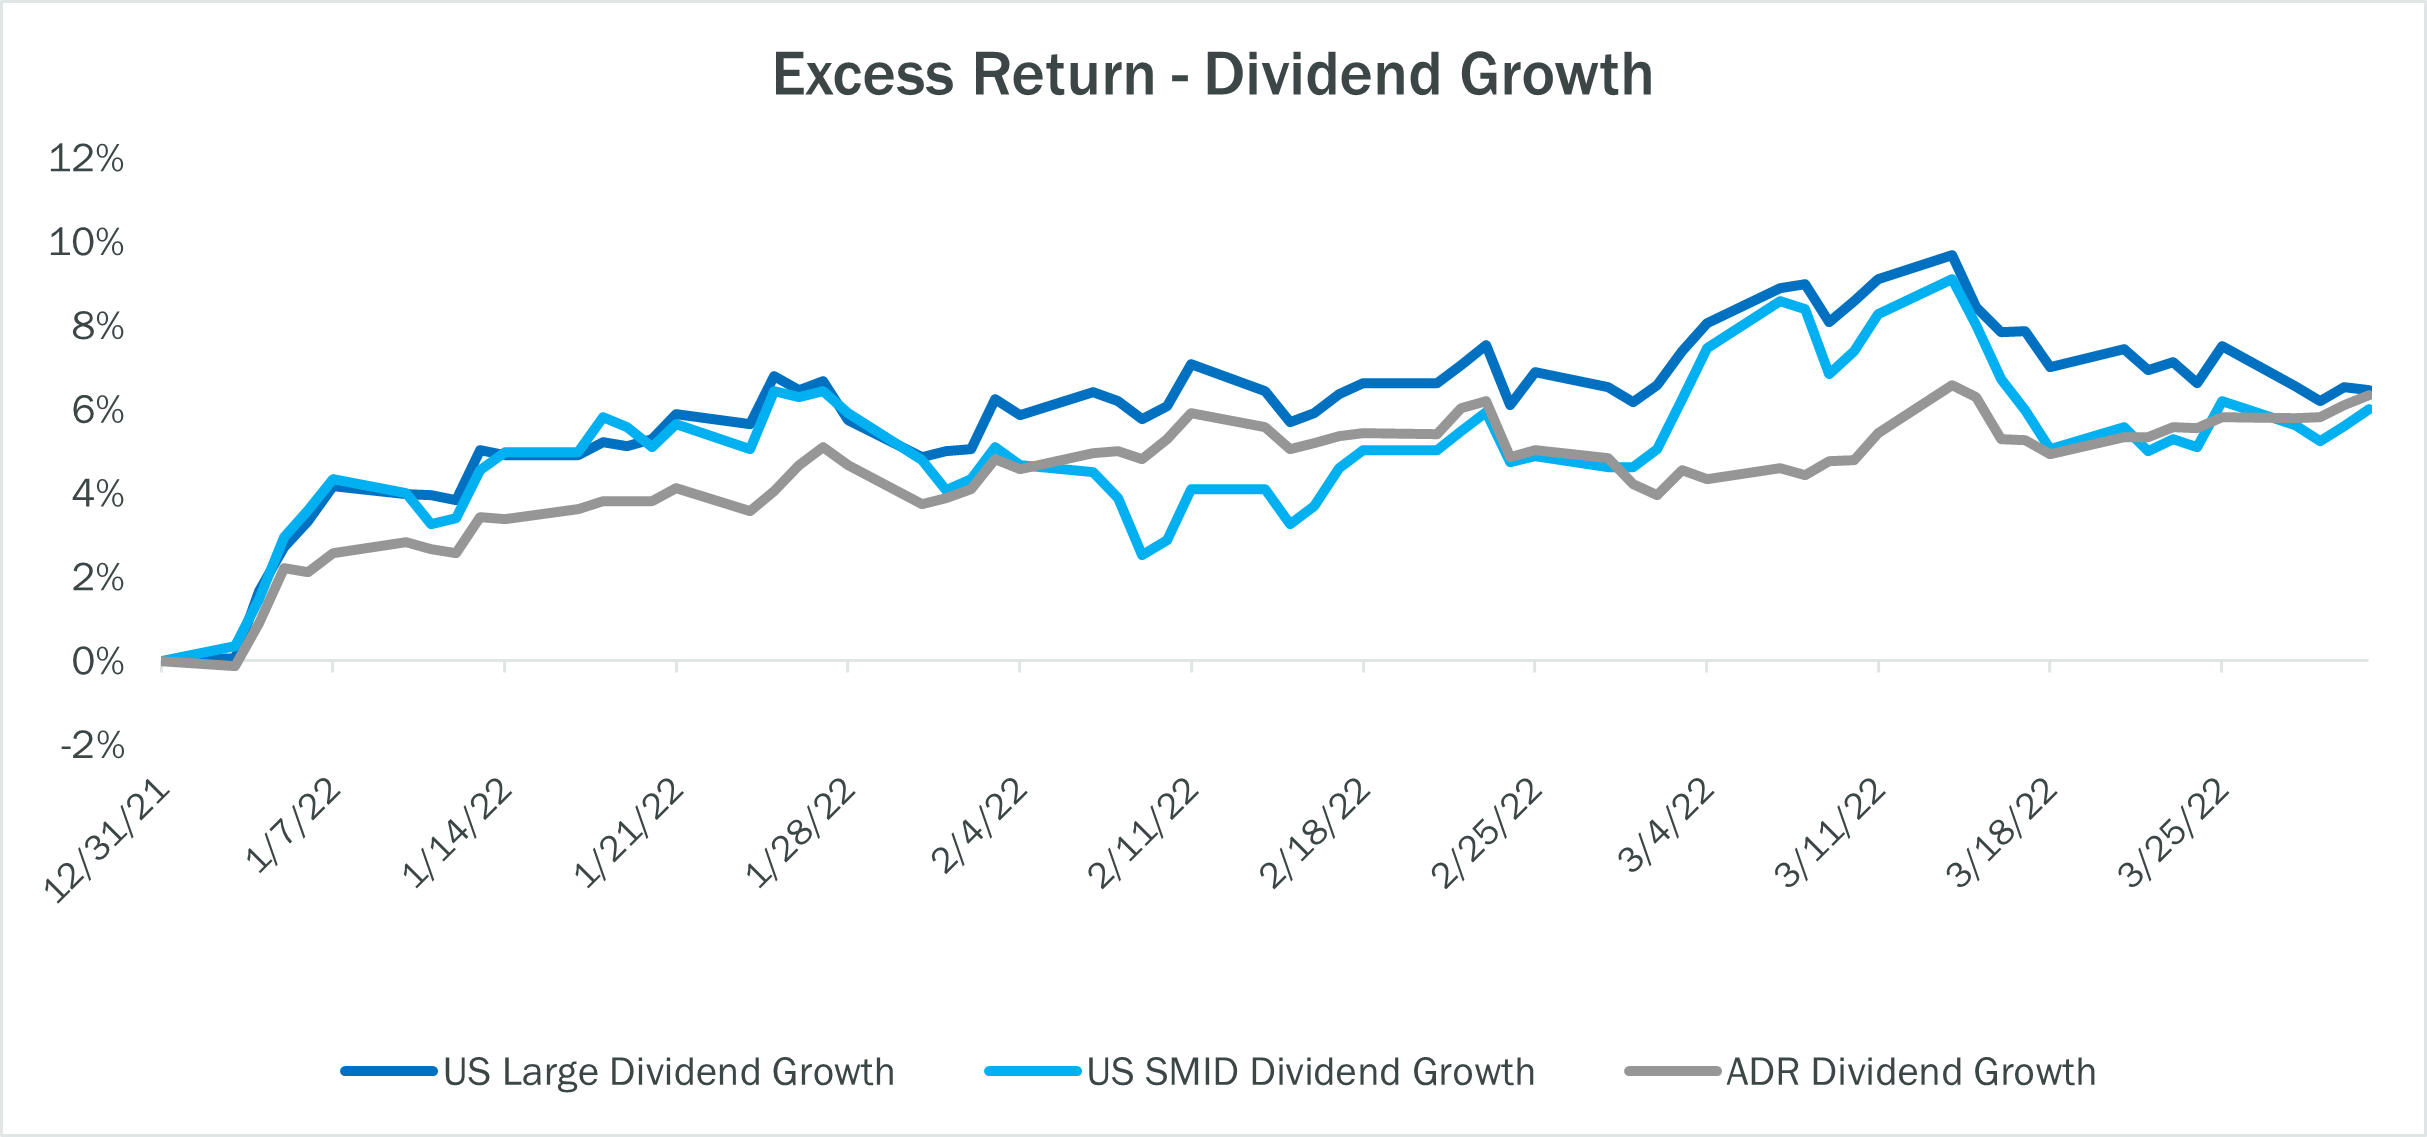
- Investors’ desire for consistently appreciating dividends drove strong outperformance among dividend growth stocks across the universes.
- In our Outlook section, we touch on three themes that we believe will be prominent in coming quarters: factor performance in historical inflation regimes, value’s “cheapness”, and potential shifts in stock-bond correlations. Though the market has priced in much of global central bank tightening, we expect monetary and macro developments will continue to generate higher than normal market volatility.
Q1 Developments
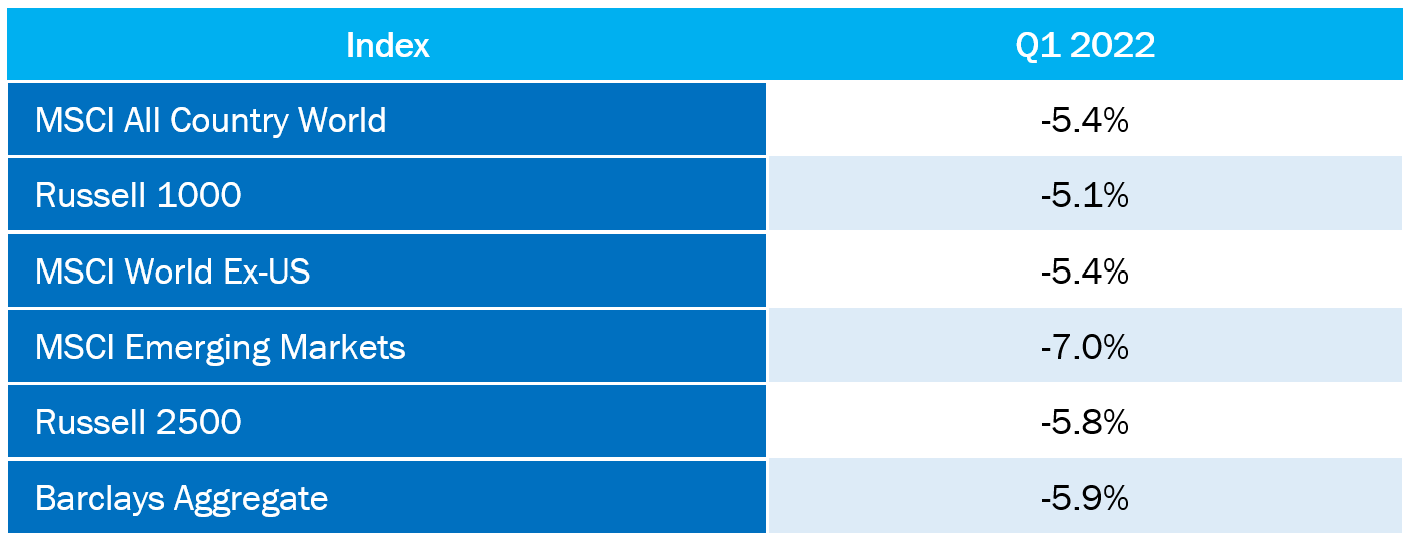
Global equity markets endured a challenging first quarter. A strong rally in late March helped recoup some of the market’s 2021 gains, but most broad market indexes finished negative for the quarter. Of the major indices, large cap U.S. stocks held up best. Developed and Emerging markets were highly correlated and lagged U.S. large cap. Value outperformed growth on average across market capitalizations. The Russell 1000® Value and Russell 2000® Value were notable outperformers versus their core and growth counterparts. Energy was a key contributor to value’s outperformance as it was one of only two positive sectors on the quarter (the other being Utilities)—no surprise given that oil had more than tripled from $40/barrel in April 2020 to $130 on March 7th. Bonds offered little solace in the equity swoon given a continuation of the bond selloff following the Federal Open Market Committee’s (FOMC) hawkish pivot in November 2021. The Barclays Aggregate bond index finished down -5.93%.
The risks and uncertainties stemming from Russia’s invasion of Ukraine underscored how interconnected the global economy has become. The U.S. and E.U. have jointly issued unprecedented sanctions against Russia—including bans on commodities, Russia’s access to the SWIFT banking network, and more. The conflict and subsequent sanctions have prompted tough conversations in the West on energy independence, secure access to commodities, and supply chains. These developments paired with China’s zero-covid policy and widespread lockdowns throughout the quarter have further exacerbated COVID supply chains issues.
Making matters worse, the issues outlined above are all happening within the backdrop of central banks’ more hawkish stance as compared to 2021’s focus on sustained employment and accommodative monetary policy. The FOMC has stated they can no longer ignore the trend from ‘transitory’ to ‘sustained’ inflation even though fiscal stimulus has generally run its course and unemployment continues to improve.
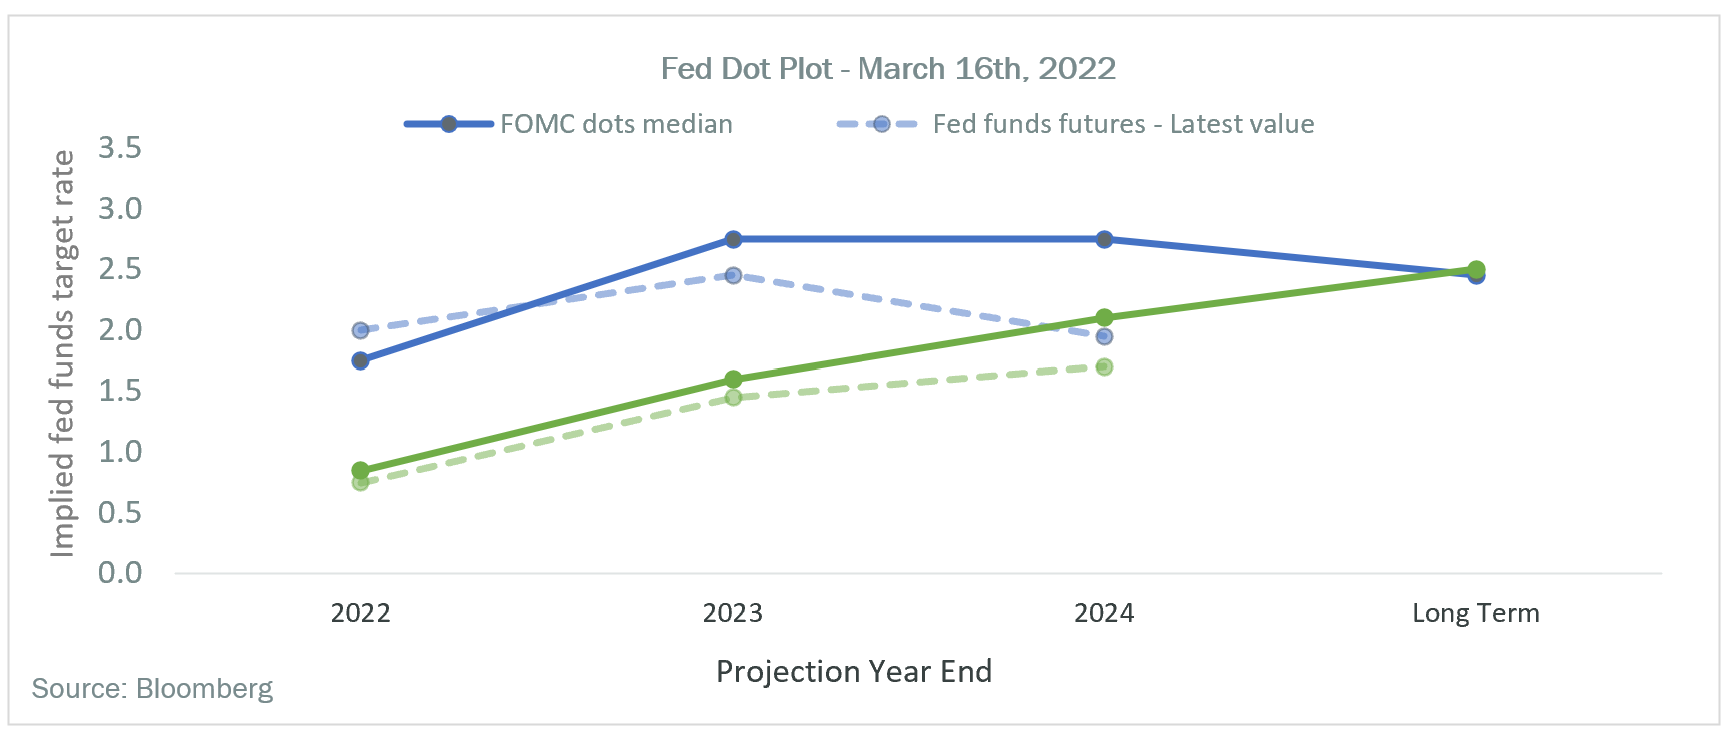
The FOMC faces tough policy choices ahead, as beating high levels of inflation has historically required raising the Fed Funds to exceed year-over-year CPI—a scary prospect currently. Yield curves inverted across a large cross-section of treasury maturities as shorter-term bond yields continue rising. 30-Year mortgages passed 5.0% for the first time since 2011. The change in the famed “dot plots” (FOMC member projections for the path of interest rates) between December and March is emblematic of the hawkish pivot that has occurred. Projections for the December 2022 and 2023 year end rate shifted up a full 1% each.
While the FOMC faces a tough task given the U.S. dollars reserve currency status, the European Central Bank (ECB) and Bank of Japan (BOJ) have even more difficult tasks due to their proximity to geopolitical events and their endemic challenges generating real economic growth.
While we do not pretend to be macro investors, we have analyzed market and factor dynamics in economic regimes with varying inflation levels, across various historical monetary and fiscal policies. Our Outlook section provides historical context for how factors and markets perform in environments exhibiting characteristics like today. Before addressing the historical precedent, let’s review the three chapters in the market’s post-COVID vaccine announcement narrative.
Factor Trends
Last quarter, we incorporated a new machine learning tool to evaluate factor drivers in performance regimes. We distilled the post-COVID vaccine environment into three regimes—an early reflationary period that gave way to a period of uncertainty, which was followed by a reaction to the FOMC’s November 2021 hawkish pivot.
At the outset of each regime, we used a classification algorithm to segment the market into four groups based only on their fundamental characteristics. We then tracked performance of the four groups to measure the spread between the highest and lowest performing. Below are the three periods, the core macro driver that influenced the market, the characteristics of top and bottom performing groups, and the performance spread between the two:
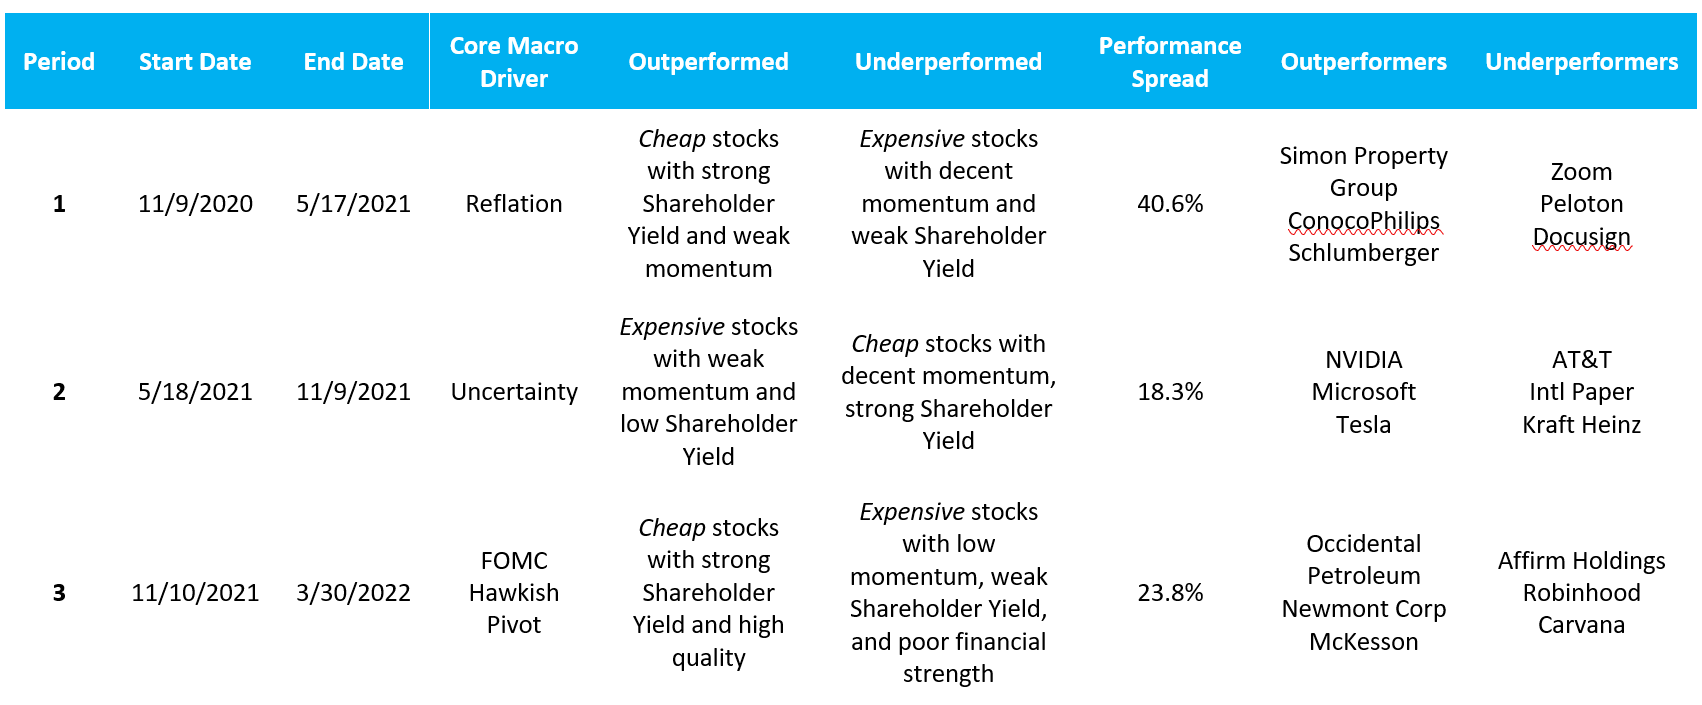
Across the periods, the most important determinants of performance were Value and Shareholder Yield. Portfolios oriented towards cheap names with strong Shareholder Yield did quite well throughout. Momentum has generally struggled, which is not a surprise given the rotations that have occurred. Momentum tends to struggle in such environments. Performance dispersion was high during the Reflation regime and moderated as monetary policy response came front and center.
Of note is that quality was more important in the latter regime than at any point in the last few years. Under the hood of the market is a more defensive posture as the mega cap growth/tech leadership of the last few years has faded. We also observed that a basket of “recession” stocks which has done quite well—outperforming the Russell 1000 Index by 6.6% as of quarter end.1
Outlook
Allocating assets has never been harder in our opinion. Asset valuations remain high, monetary and fiscal policy are taking a step back, geopolitics are on overdrive, and corporate results face some challenging comps when compared to 2021. One can’t help but think we are at the doorstep of a regime change given the recent spikes in inflation. Markets do tend to climb the wall of worry adeptly so we will see if pessimism is warranted.
With this context, we want to highlight three key themes for investors moving forward:
- Inflation will likely run hot for a while. While the structural elements don’t currently exist for a prolonged 1970’s style stagflation, inflation will likely remain elevated for a few years.
- Fundamentals will matter again. In high inflation environments, avoiding poor quality and seeking discounted valuation is generally rewarded. This is notable, given the near-historic valuation spread between value and growth stocks.
- Bonds will behave differently moving forward: We generally expect bonds to rise when stocks fall. Our research suggests that relationship may not persist.
Great Inflation Round 2?
Persistently high inflation figures have prompted many investors to question whether we are entering another period of prolonged stagflation. Nobody knows for certain, but we tend to lean against the stagflation case. In The Great Inflation, Factors, and Stock Returns, we highlighted four key elements that drove structural inflation in the 1970’s:
- Monetary Policy was extremely loose – The prospect of battling inflation at the cost of higher unemployment was untenable, so inflation was allowed to run rampant.
- Labor had strong bargaining power – 30% of the U.S. workforce was unionized and had substantial collective bargaining power to enact wage increases.
- High taxes perpetuated a wage-price spiral – The marginal tax rate for the average worker increased 57% during the Great Inflation while corporate taxes persisted at 48%.
- Energy policy left the U.S. susceptible to shocks – The U.S. imported 23% of energy consumption in 1979 versus -4% today.
Among these elements, only monetary policy’s influence is comparable today—quantitative easing has been the de facto policy tool since the GFC. Although explicit quantitative easing was not used during The Great Inflation, the growth of monetary aggregates and banking reserves – which is inherently inflationary – was left unchecked until Paul Volker arrived in 1979.
It should be noted that The Great Inflation occurred before the financialization of America’s economy during the Great Moderation (1983-2007). Thus, we think that dovish monetary policy post-GFC has driven asset inflation, rather than “goods” inflation like in the 1970’s. This viewpoint is supported by trends in the velocity of money, which is the ratio of GDP to money supply. The charts below compare money velocity during the Great Inflation and post-GFC period. The velocity of money increased during the Great Inflation, but trended downward post-GFC. This suggests that monetary and fiscal stimulus has been funneled into asset markets, not directly into the “real” economy.
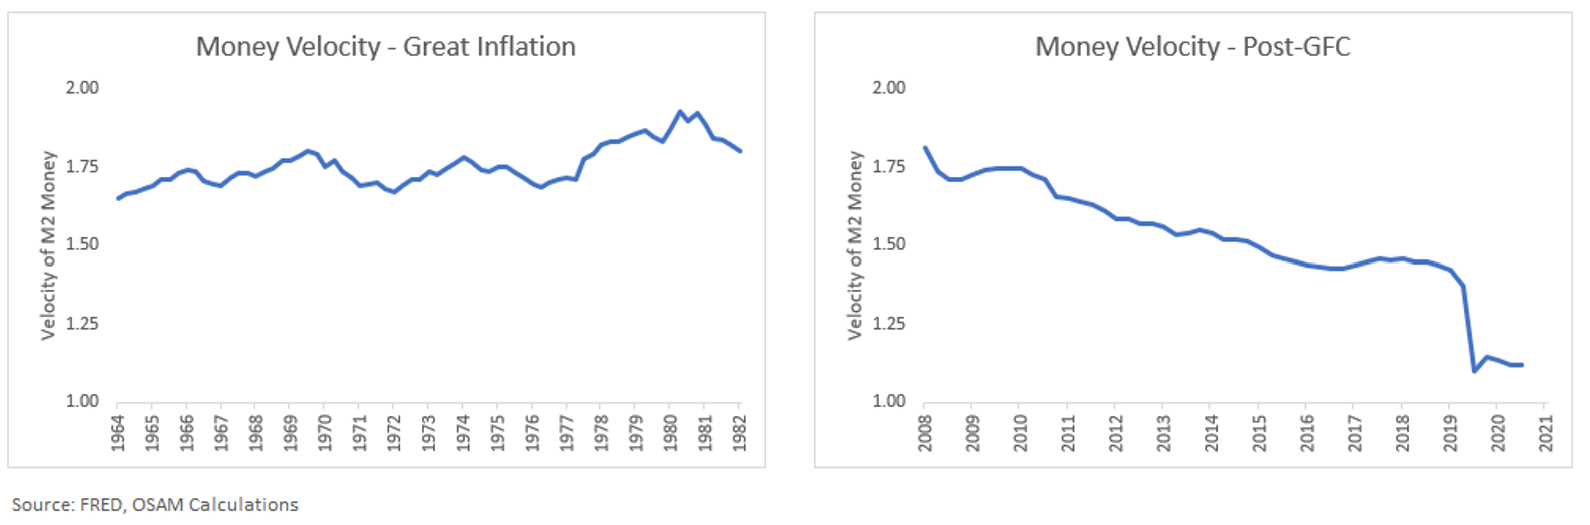
If the current velocity of money begins trending upwards, it may indicate that stimulus is starting to flow through the “real” economy, which would increase the risk of prolonged structural inflation.
Fundamentals in Inflationary Environments
High Inflation Factor Performance
Due to mangled supply chains and knock-on effects from the Russia-Ukraine conflict, we will likely endure a bout of inflation that is higher than what we are accustomed to. Our research suggests that fundamentals are important in inflationary regimes.
Our recent inflation piece ranked monthly year-over-year inflation observations from 1926-2021, grouped them from lowest to highest, and treated each group as an “inflation regime”. The average annual inflation levels for each group is shown below.
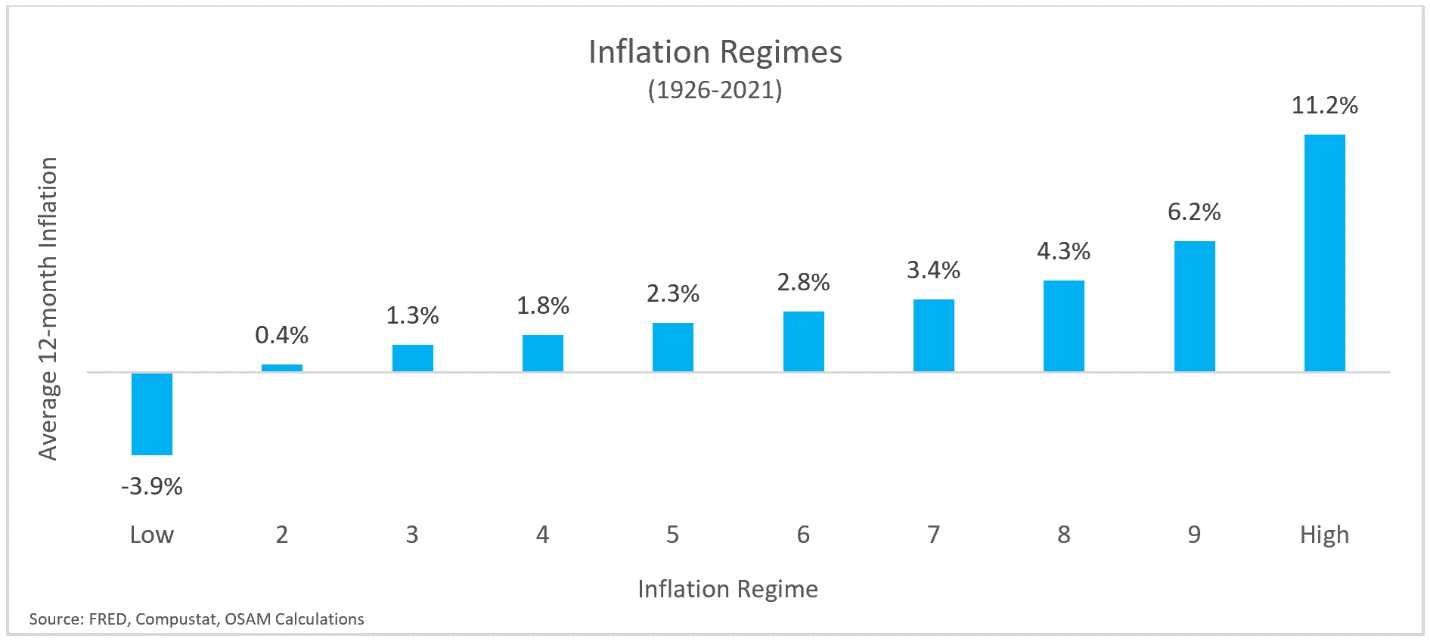
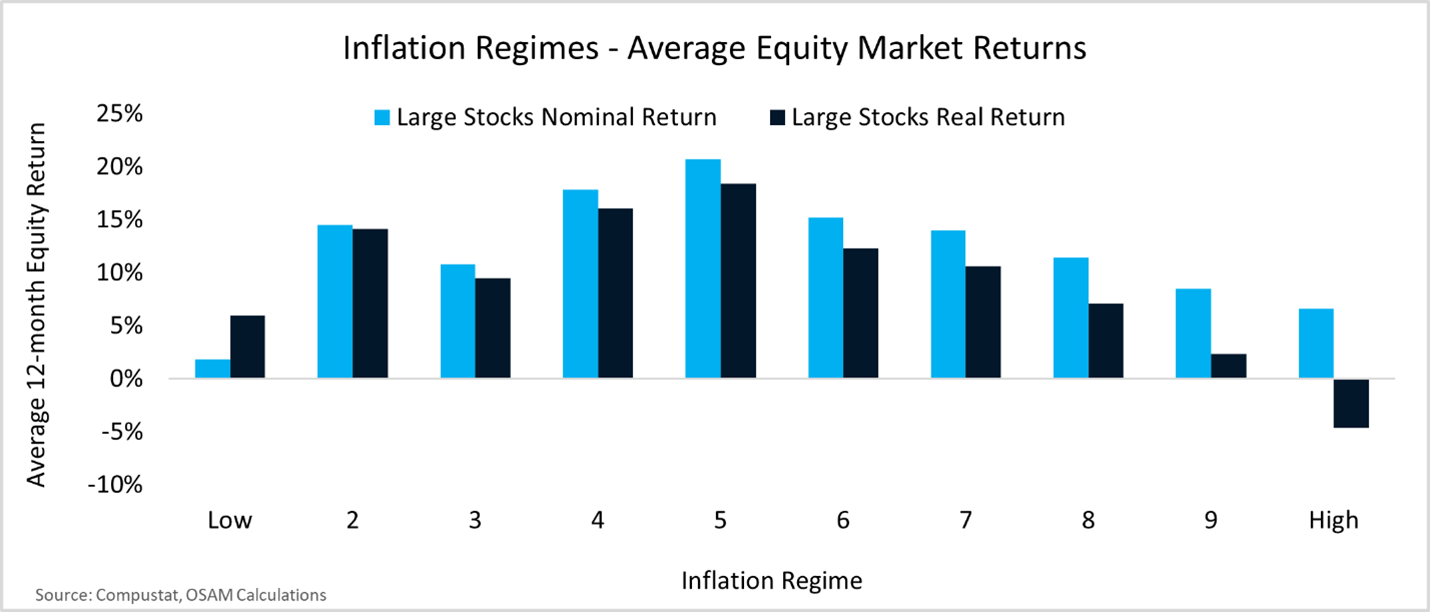
We then evaluated overall stock returns within each inflation regime on a nominal and inflation-adjusted (real) basis. Stock returns decline as inflation increases but maintain purchasing power in all but the highest inflation regime, when inflation averages 11.2%.
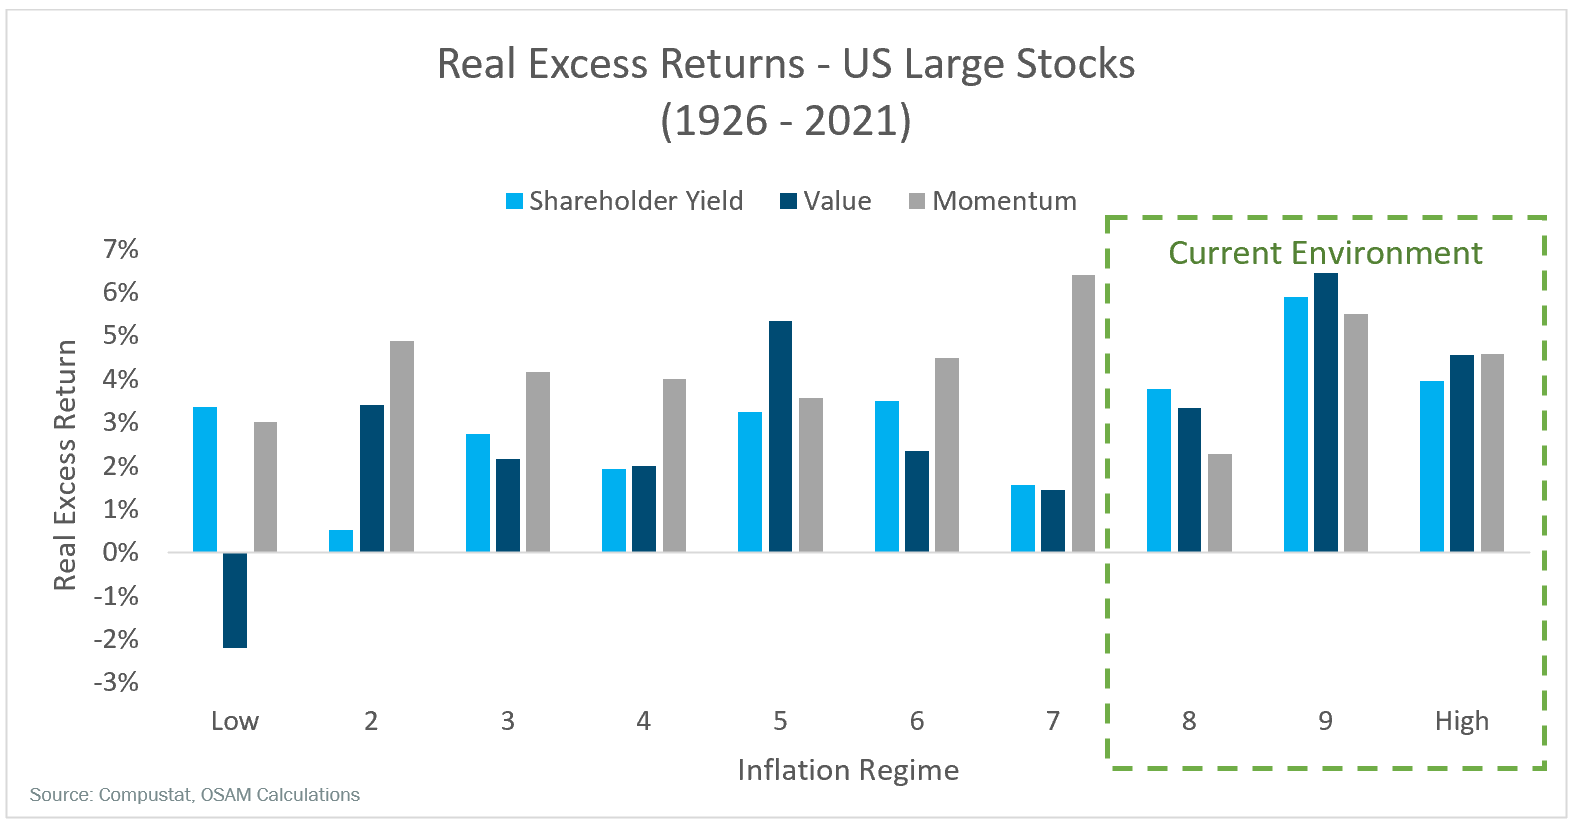
Focusing on higher inflation regimes reveals that key selection factors—Value, Momentum, and Shareholder Yield—generate positive excess return on a real basis, which helps maintain purchasing power.
Value is Cheap
While historic precedent argues for some factor exposure, current valuations bolster the case. We often get asked whether value stocks are “cheap”. The current answer is “yes”, with the caveat that they’ve been cheap for a while. Valuation tends to be a poor timing mechanism for all but true long-term investors.
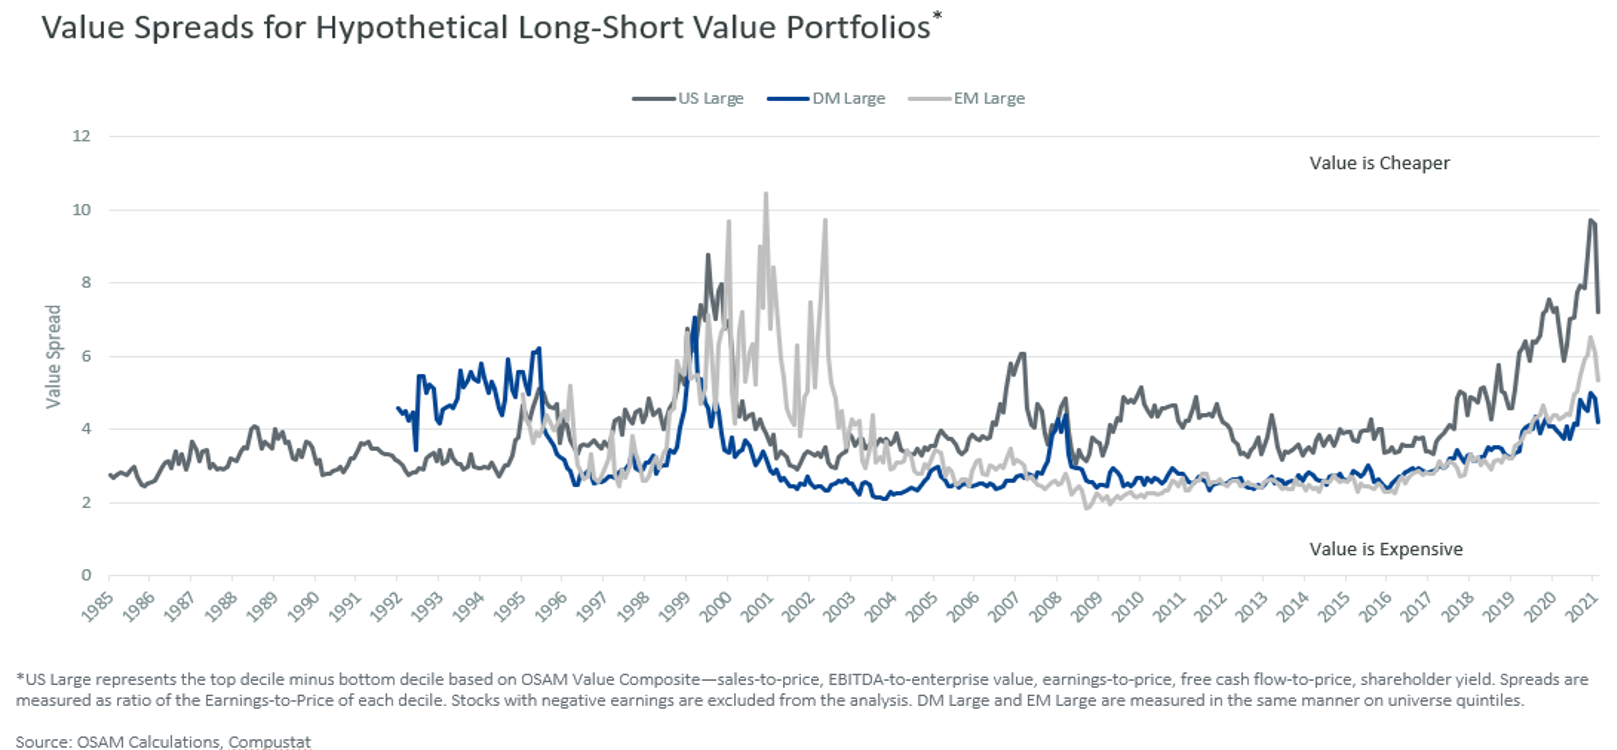
To answer whether value stocks are “cheap”, we assessed large cap stocks across U.S., Developed, and Emerging Markets. Stocks within each market were divided into groups by our value theme, which rankings for sales, cash flows, and earnings relative to price. After establishing these groups, we calculated the price-to-earnings (PE) ratio of each group and evaluated the spread between PE ratios of the cheapest and most expensive group.2 A higher spread suggests value is cheap relative growth.
The chart above illustrates this “value spread” in each market over time. The previous standout episode of value “cheapness” in the late 1990s preceded the Tech Bubble. This valuation dislocation was obvious, but difficult to act on given the relentless rise of growth stocks. Growth outperformed throughout the late 1990’s in dramatic fashion, but Value subsequently outperformed from roughly 2000 to 2007.
A similar episode of market “irrationality” has persisted in recent years as growth stocks have generally been the market leaders. The distortion was most prevalent in the U.S. as COVID exacerbated the dominance of growth stocks. At the end of 2021 value was cheaper (relative to growth) than at any point in at least 35 years.
We did a similar analysis using our Shareholder Yield theme—dividends plus share buyback activity—to understand whether high Shareholder Yield is cheap relative to low Shareholder Yield. We found an interesting trend: High Shareholder Yield firms have become persistently cheaper than their counterparts since the 2008 Global Financial Crisis (GFC).
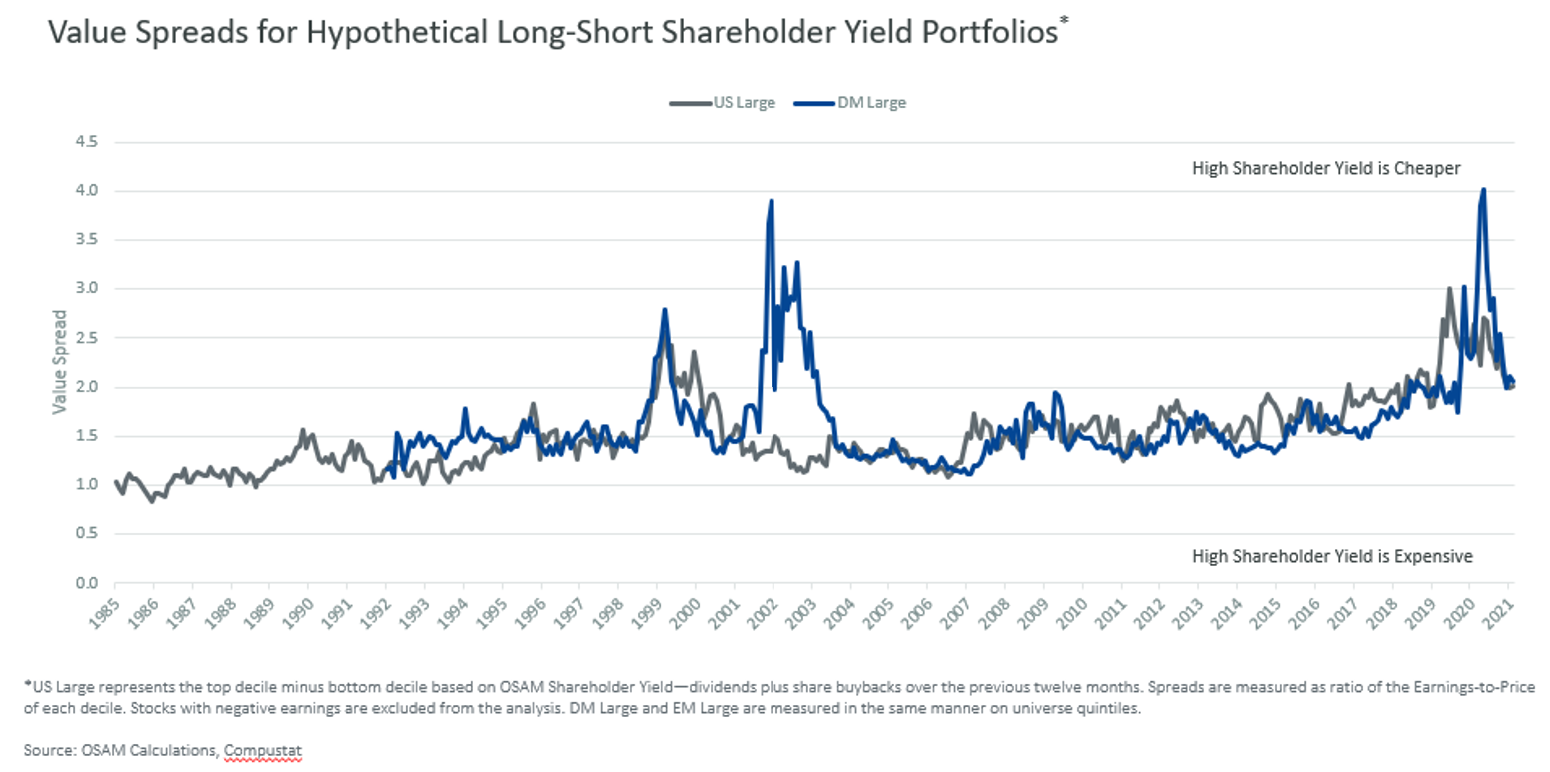
One potential explanation is that buybacks act as a tailwind to earnings-per-share for firms utilizing buybacks as a capital allocation tool. When buybacks occur, share count gets reduced, which in turn boosts earnings per share. The opposite occurs to companies that dilute their shareholders through stock issuance, a popular trend among growth stocks since the GFC.
Core Principals of Diversification and Stock-Bond Correlations
Markets were refamiliarized with volatility in the first quarter. The post-COVID world has become one of uncertainty on all fronts—personal, fiscal, monetary, and geopolitical. We also find ourselves on the precipice of a major shift in monetary policy—easing to tightening. This occurs in every business cycle and in some ways will be no different, but in other ways couldn’t be any more different. We are emerging from a four-decade long trend of downward rates, which is bound to impact asset class performance.
Many investors have predicted an end to the bond bull market since the GFC and it appears those predictions have finally come true following the worst performance for bonds in decades, and the Federal Open Market Committee (FOMC) in the initial stages of liftoff. The difference between the last decade and now, of course, is inflation (which tends to have a deleterious effect on bond returns).
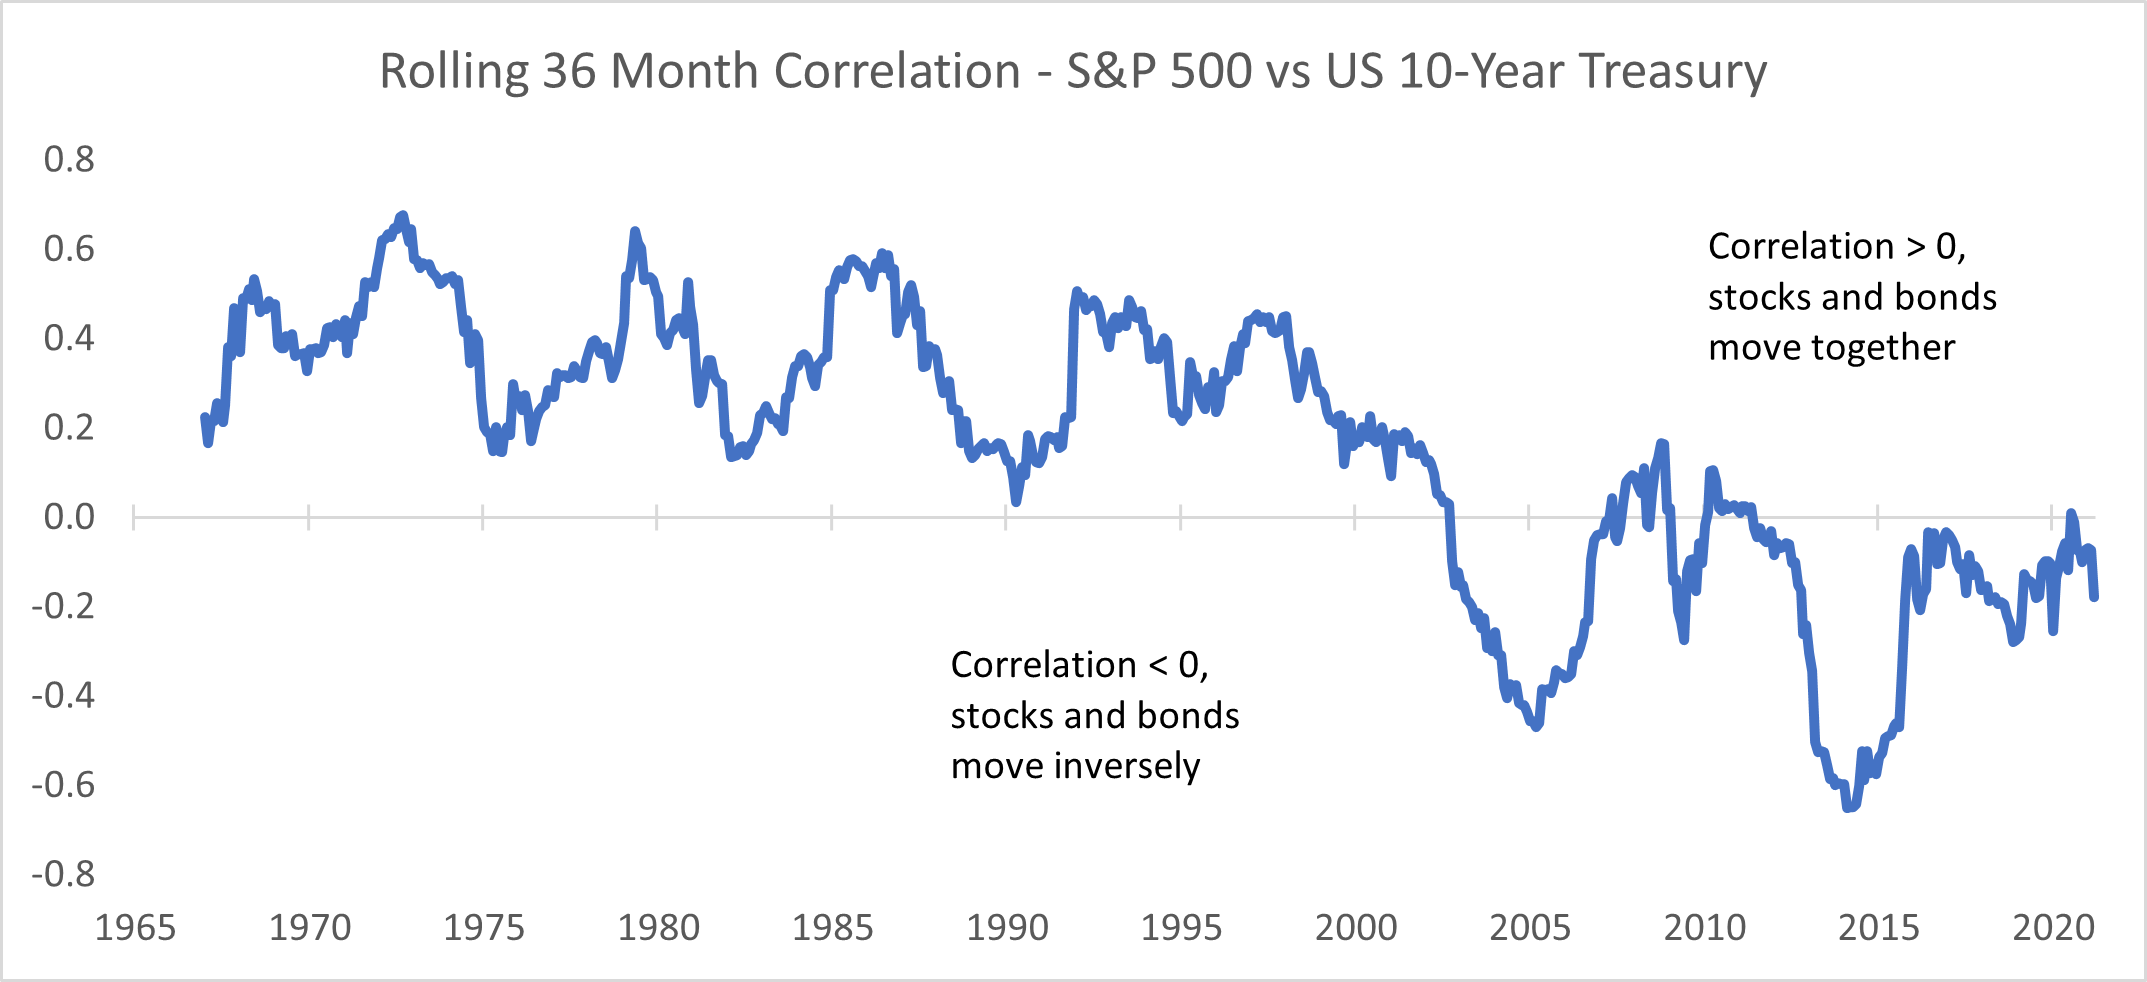
As inflation has moved higher in the post-COVID world, bonds have not fulfilled their diversification promise. Recently, in fact, bonds have been highly correlated with stocks in down markets recently. This is not historically unprecedented and can persist for long periods of time.
We pulled 10-Year U.S. Treasury yields from the Federal Reserve’s FRED database and converted them into returns to look at correlations versus the S&P 500 Index. The chart below shows the rolling 36-month correlation. Note that the correlation is positive and persistent for decades prior to the Tech Bubble. A positive correlation can imply a no or low diversification benefits.
We then broke down the correlation according to various regimes—The Great Inflation, The Great Moderation, Post-GFC, and Post-COVID—and in up / down equity markets.
Over the full 1963-2022 dataset, stocks and bonds produce a correlation of 0.13, but that varies substantially by regime.
During the Great Inflation, bonds were positively correlated with stocks in down equity markets. In other words, bonds were down when stocks were down. During the Great Moderation and post-GFC regimes, stocks and bonds were inversely correlated in equity down markets, suggesting bond allocations provided diversification benefits.
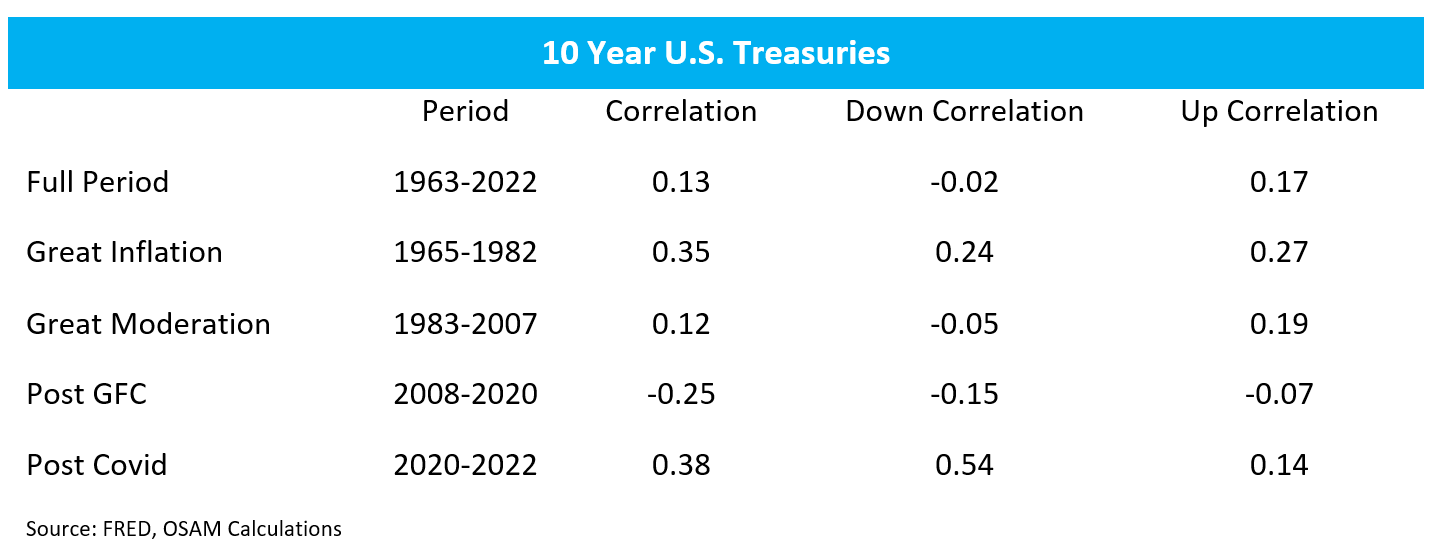
So far, the post-COVID regime shows the highest correlation of all the regimes, including in down markets. To be clear, we aren’t suggesting investors abandon fixed income, but our expectations need adjusting.
Historically, bonds serve two purposes in asset allocation frameworks—volatility reduction and income generation.
Despite the recent increase in interest rates, bond yields are still low compared to the income needs of most investors. Investors have battled this issue for over a decade, experimenting with solutions like increasing credit risk, generating alternative sources of income through option overlays, etc.
If, however, the volatility reduction component of bond allocations is diminished, a potential solution might be reducing risk on equity allocations as well. We recently published a piece highlighting the benefits of our Defensive Stability strategy: Hope for the Best, But Prepare for the Worst: Defensive Equity Investing in An Uncertain Market.
The strategy looks at five-year trailing volatility of fundamental and price metrics to select a portfolio of stocks meant to have low downside capture in down markets and lower than market volatility overall. We have seen an increase in interest in this strategy among Canvas partners in the last few months as volatility has ratcheted up.
Given the current macro backdrop, geopolitical tensions, supply chain issues, and a generational shift in monetary policy, it seems completely normal to expect asset markets to be volatile over the next few quarters as they adjust to whatever the new normal becomes. As that occurs, we will continue to invest according to our mandates, focusing on best-in-class execution, ongoing research, and harvesting losses (for taxable accounts) when able. The current environment may seem dauting, but on a long enough horizon for patient investors, opportunities abound.
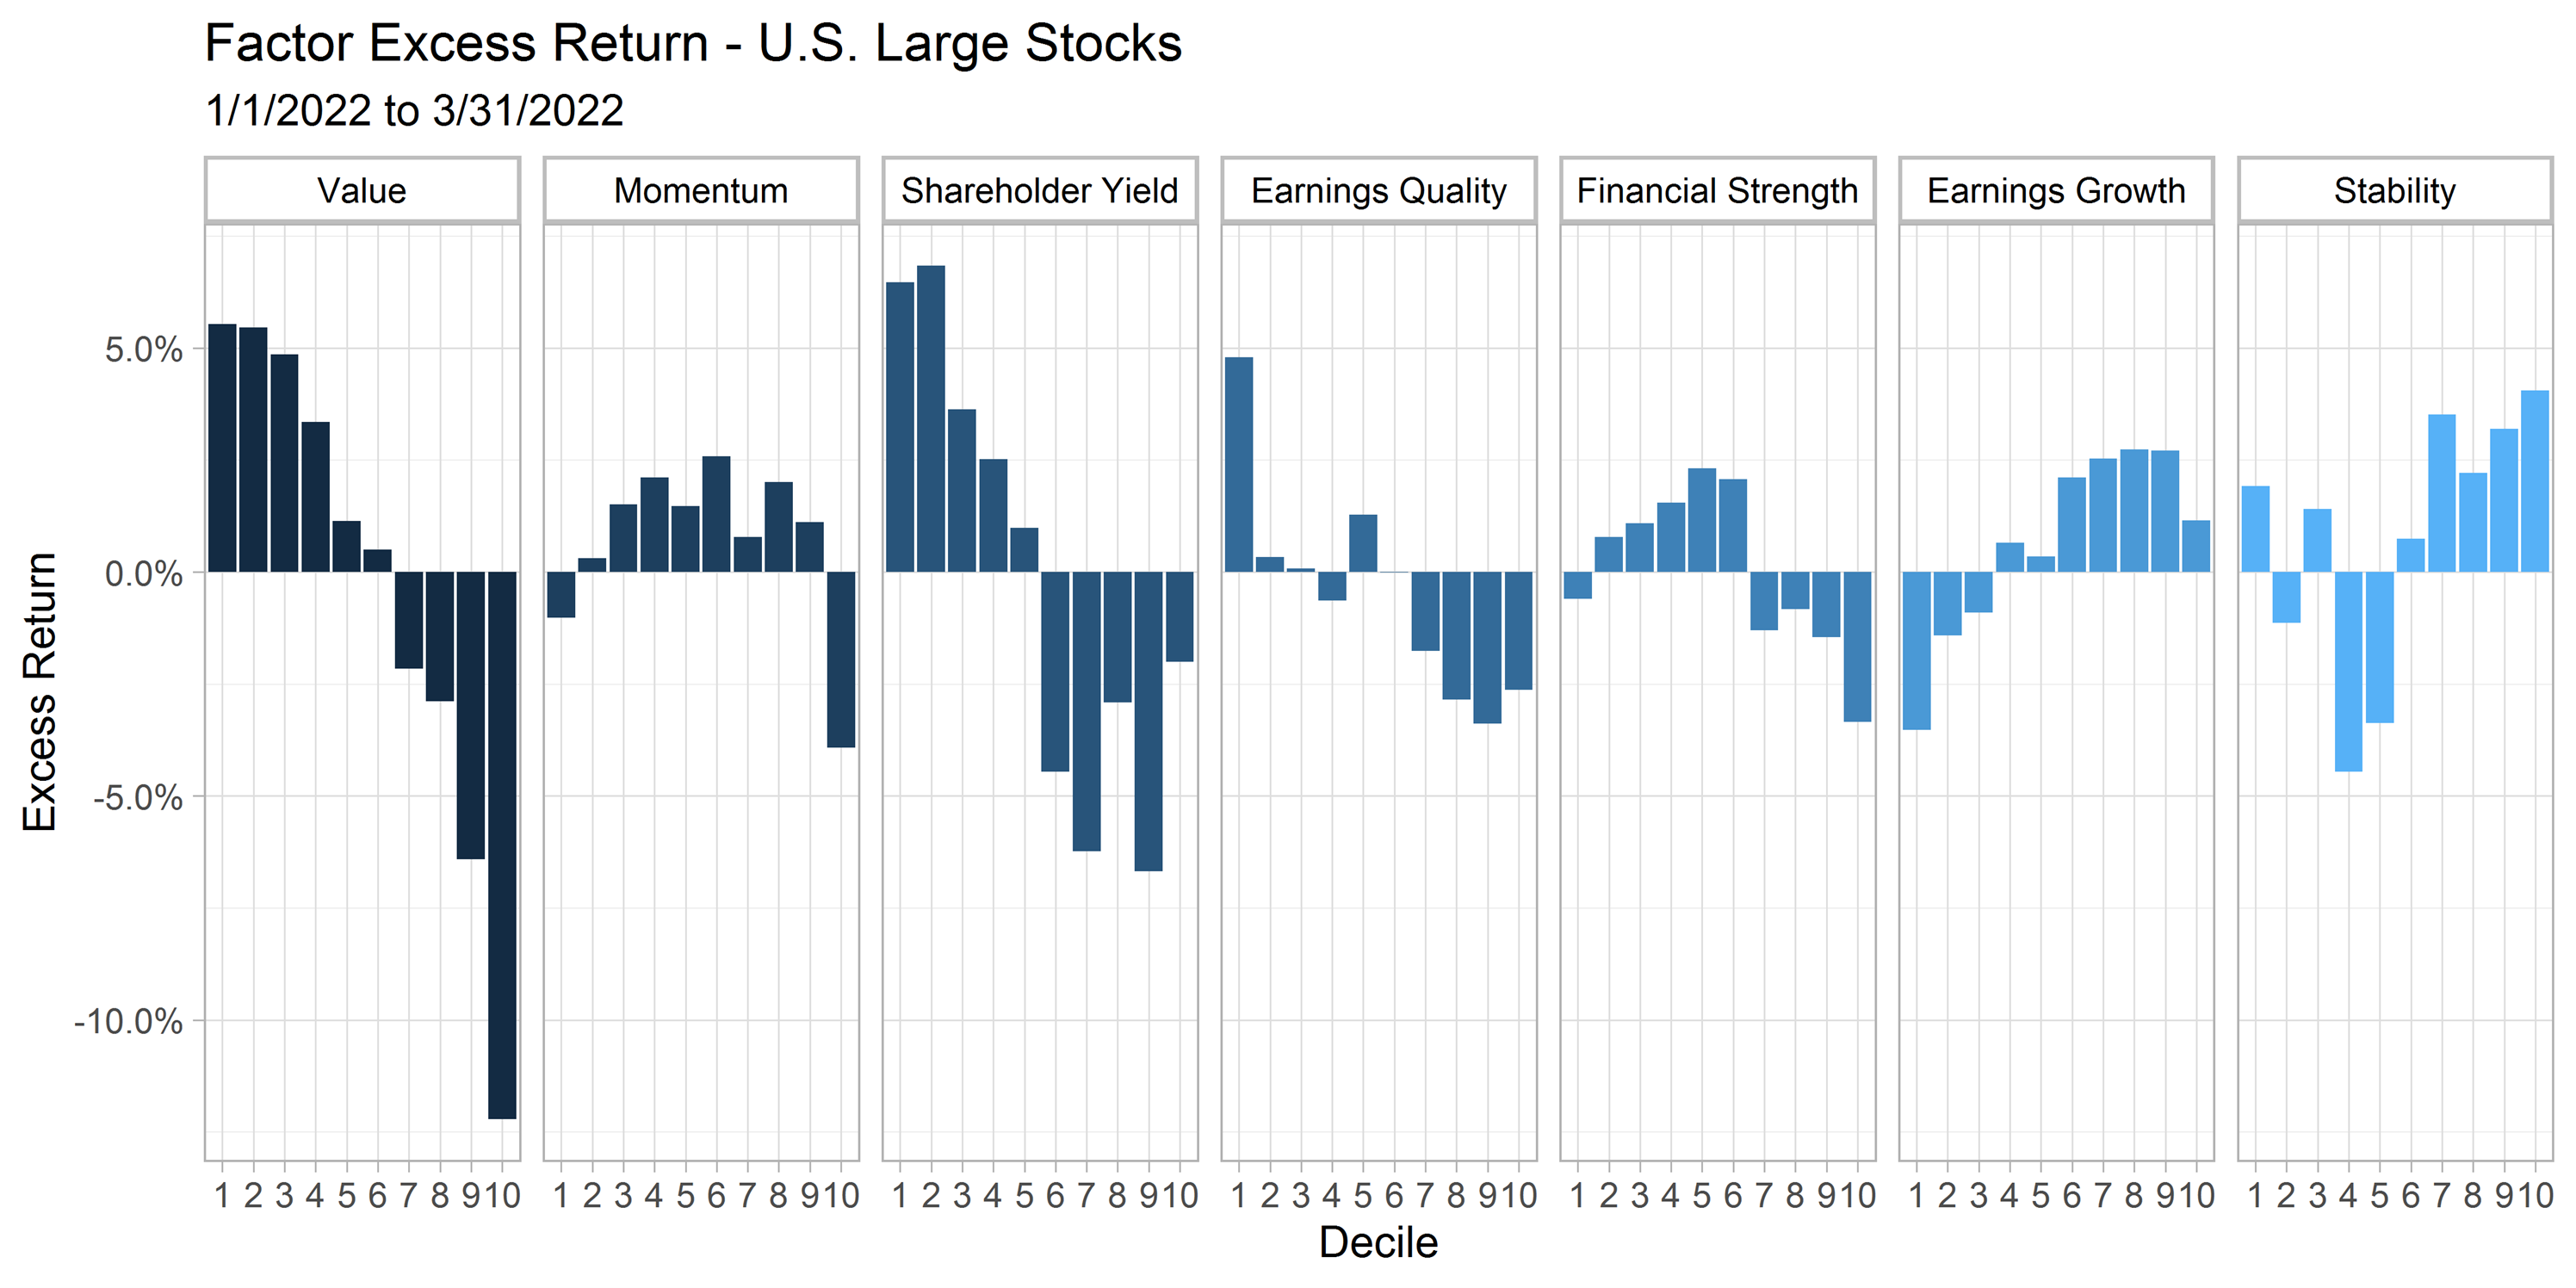
Factor Performance
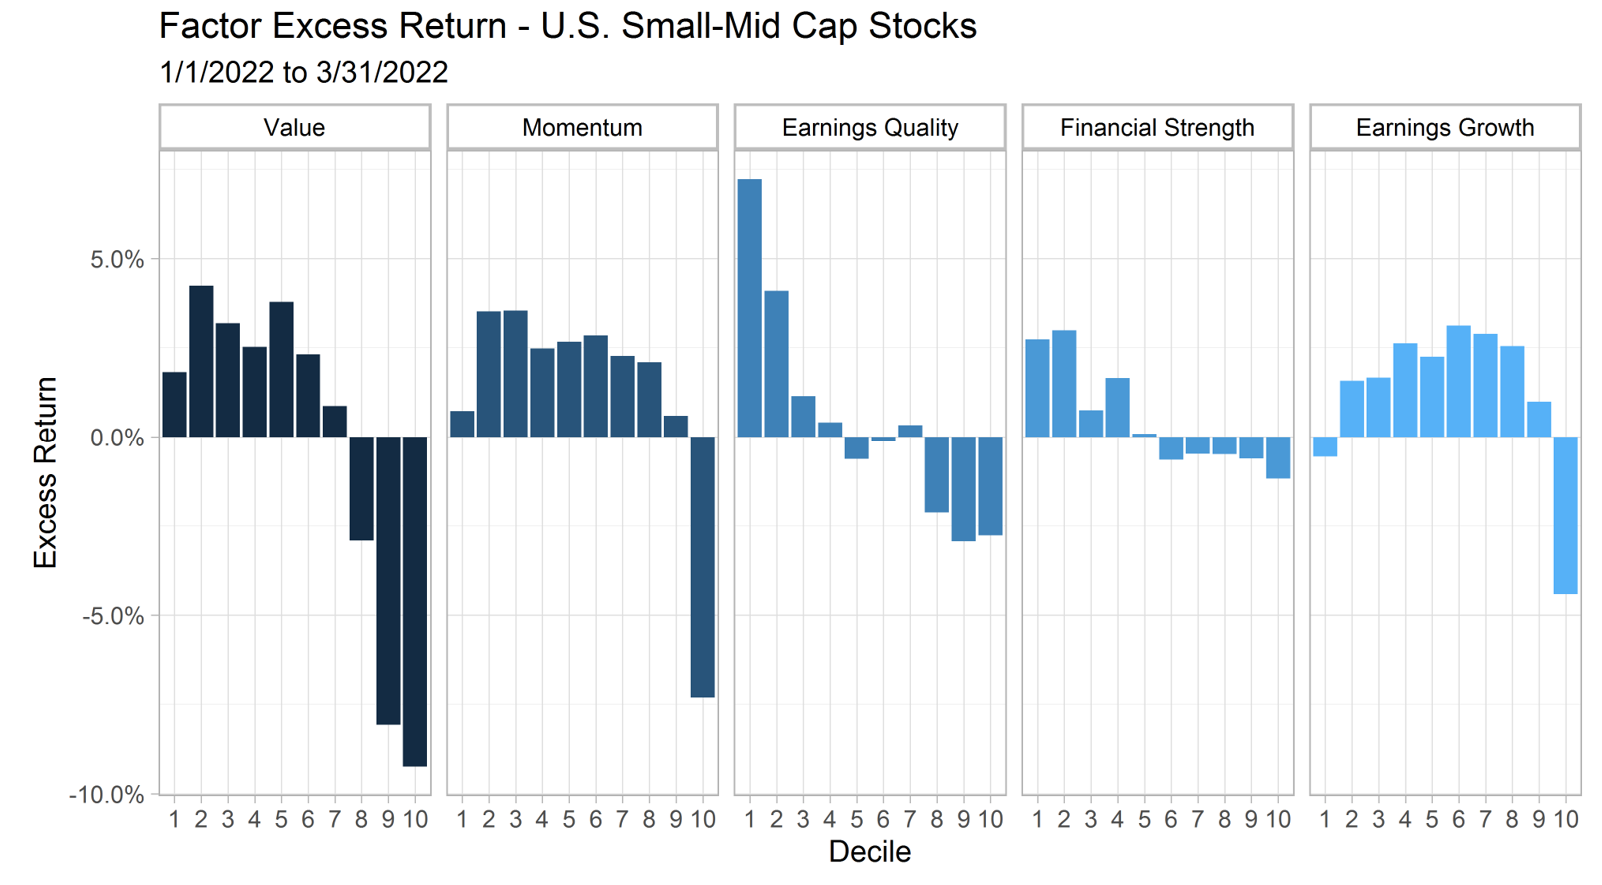
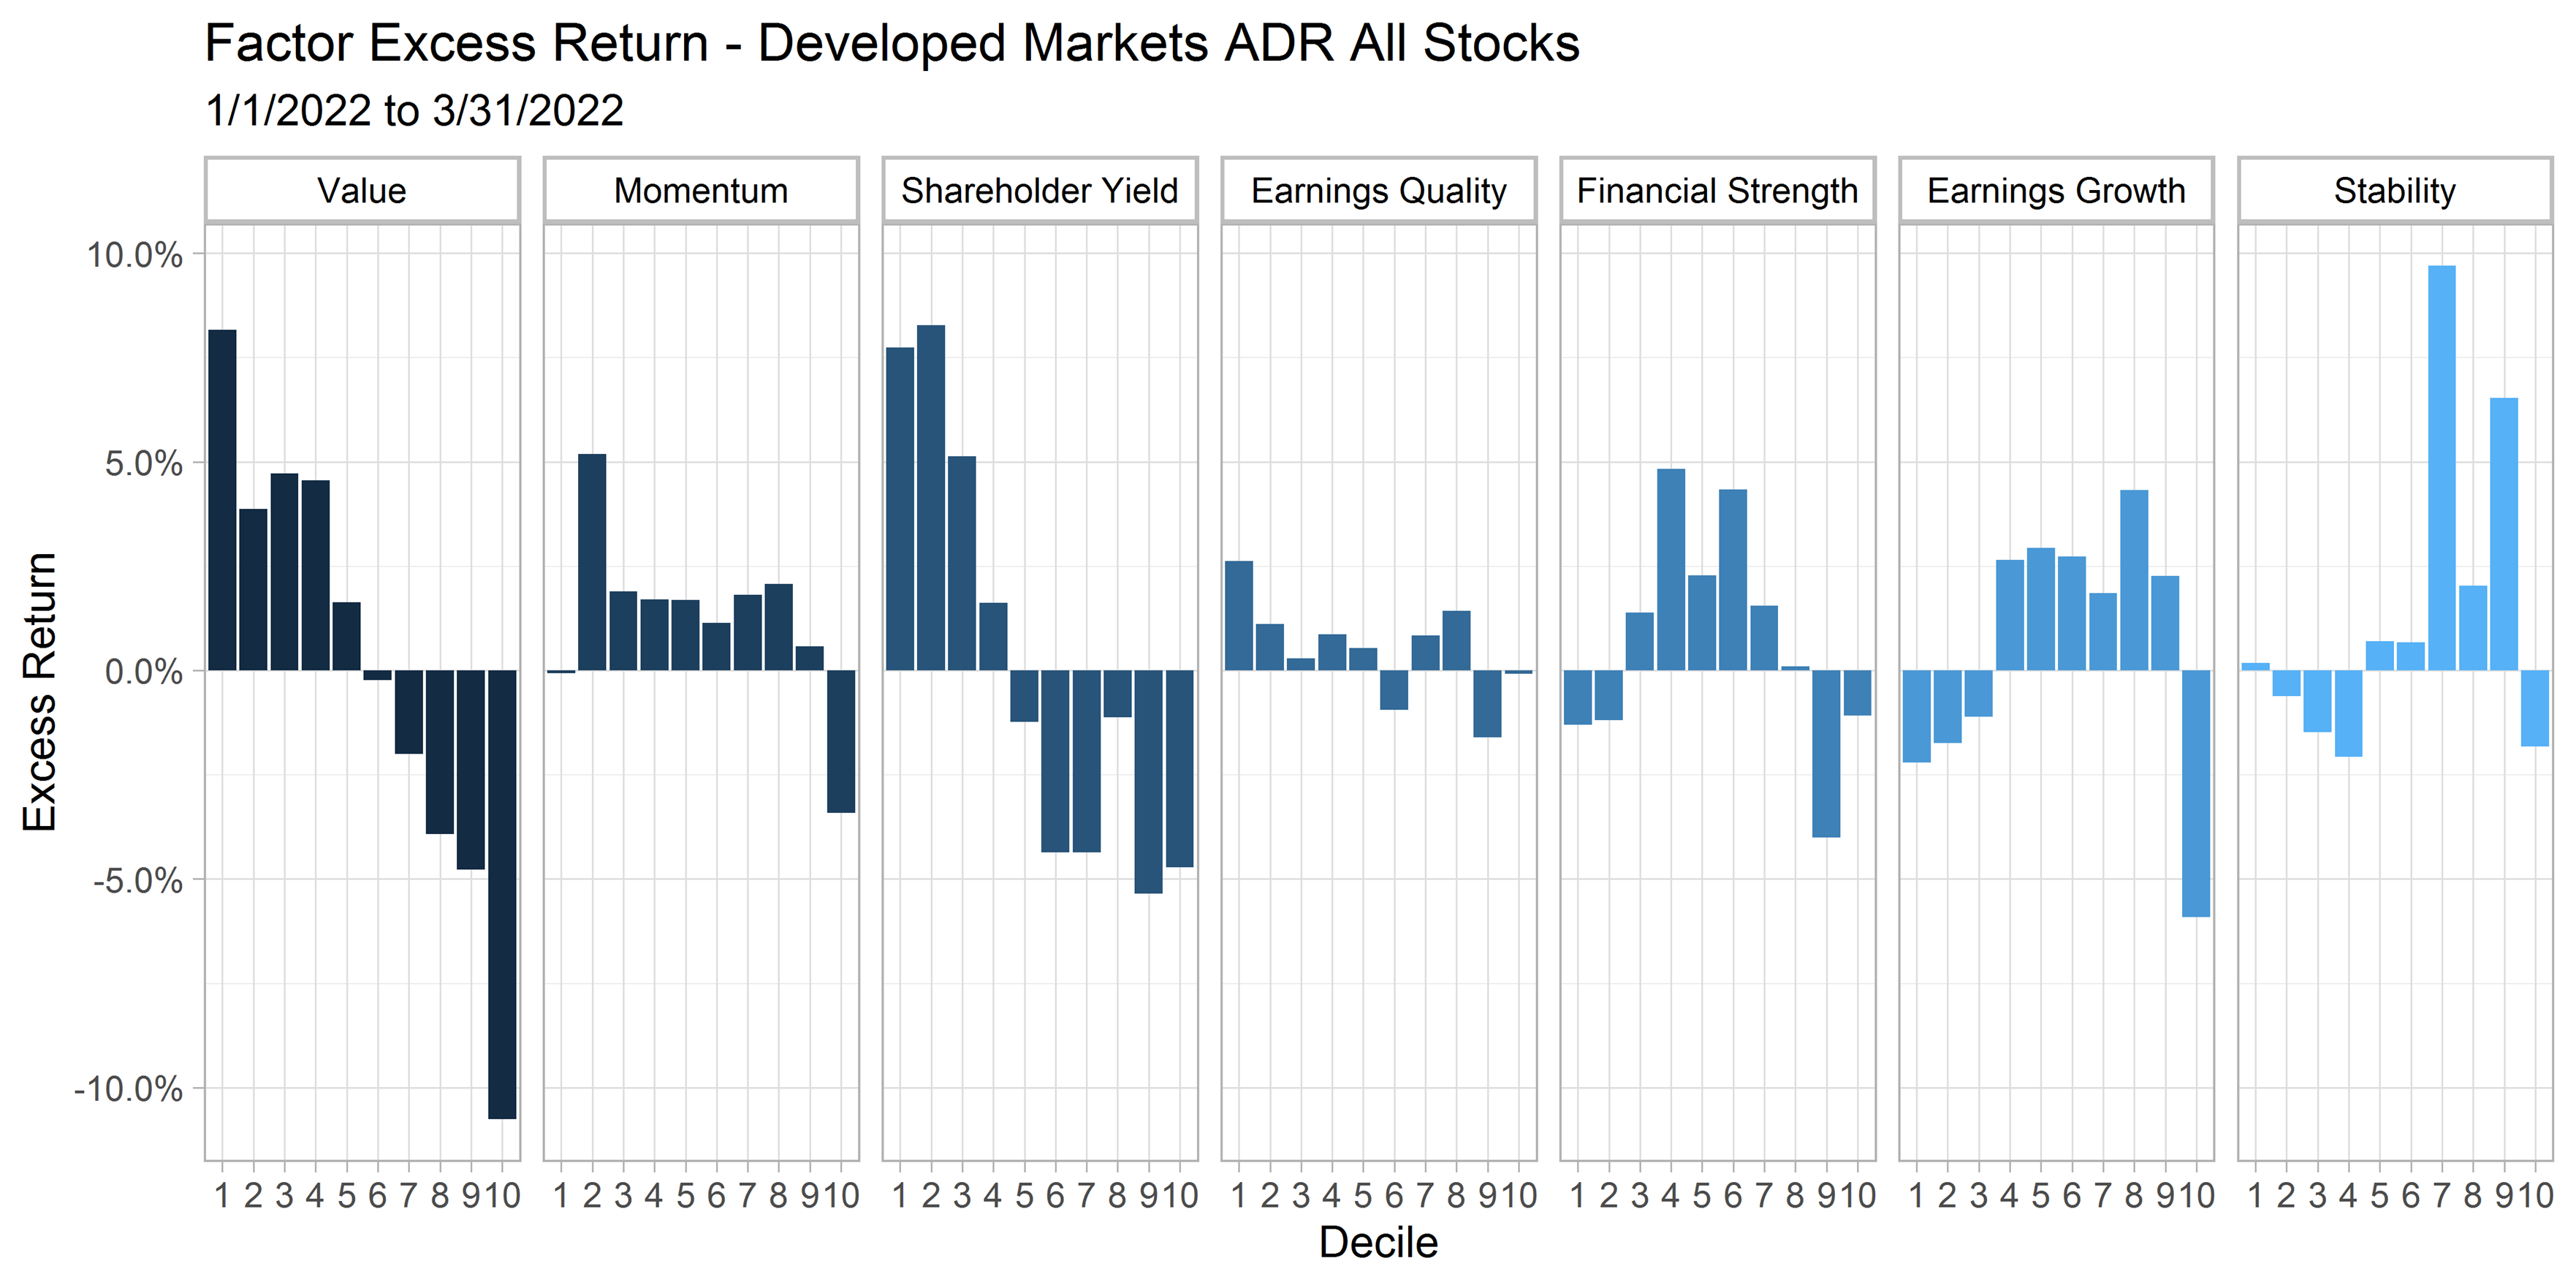
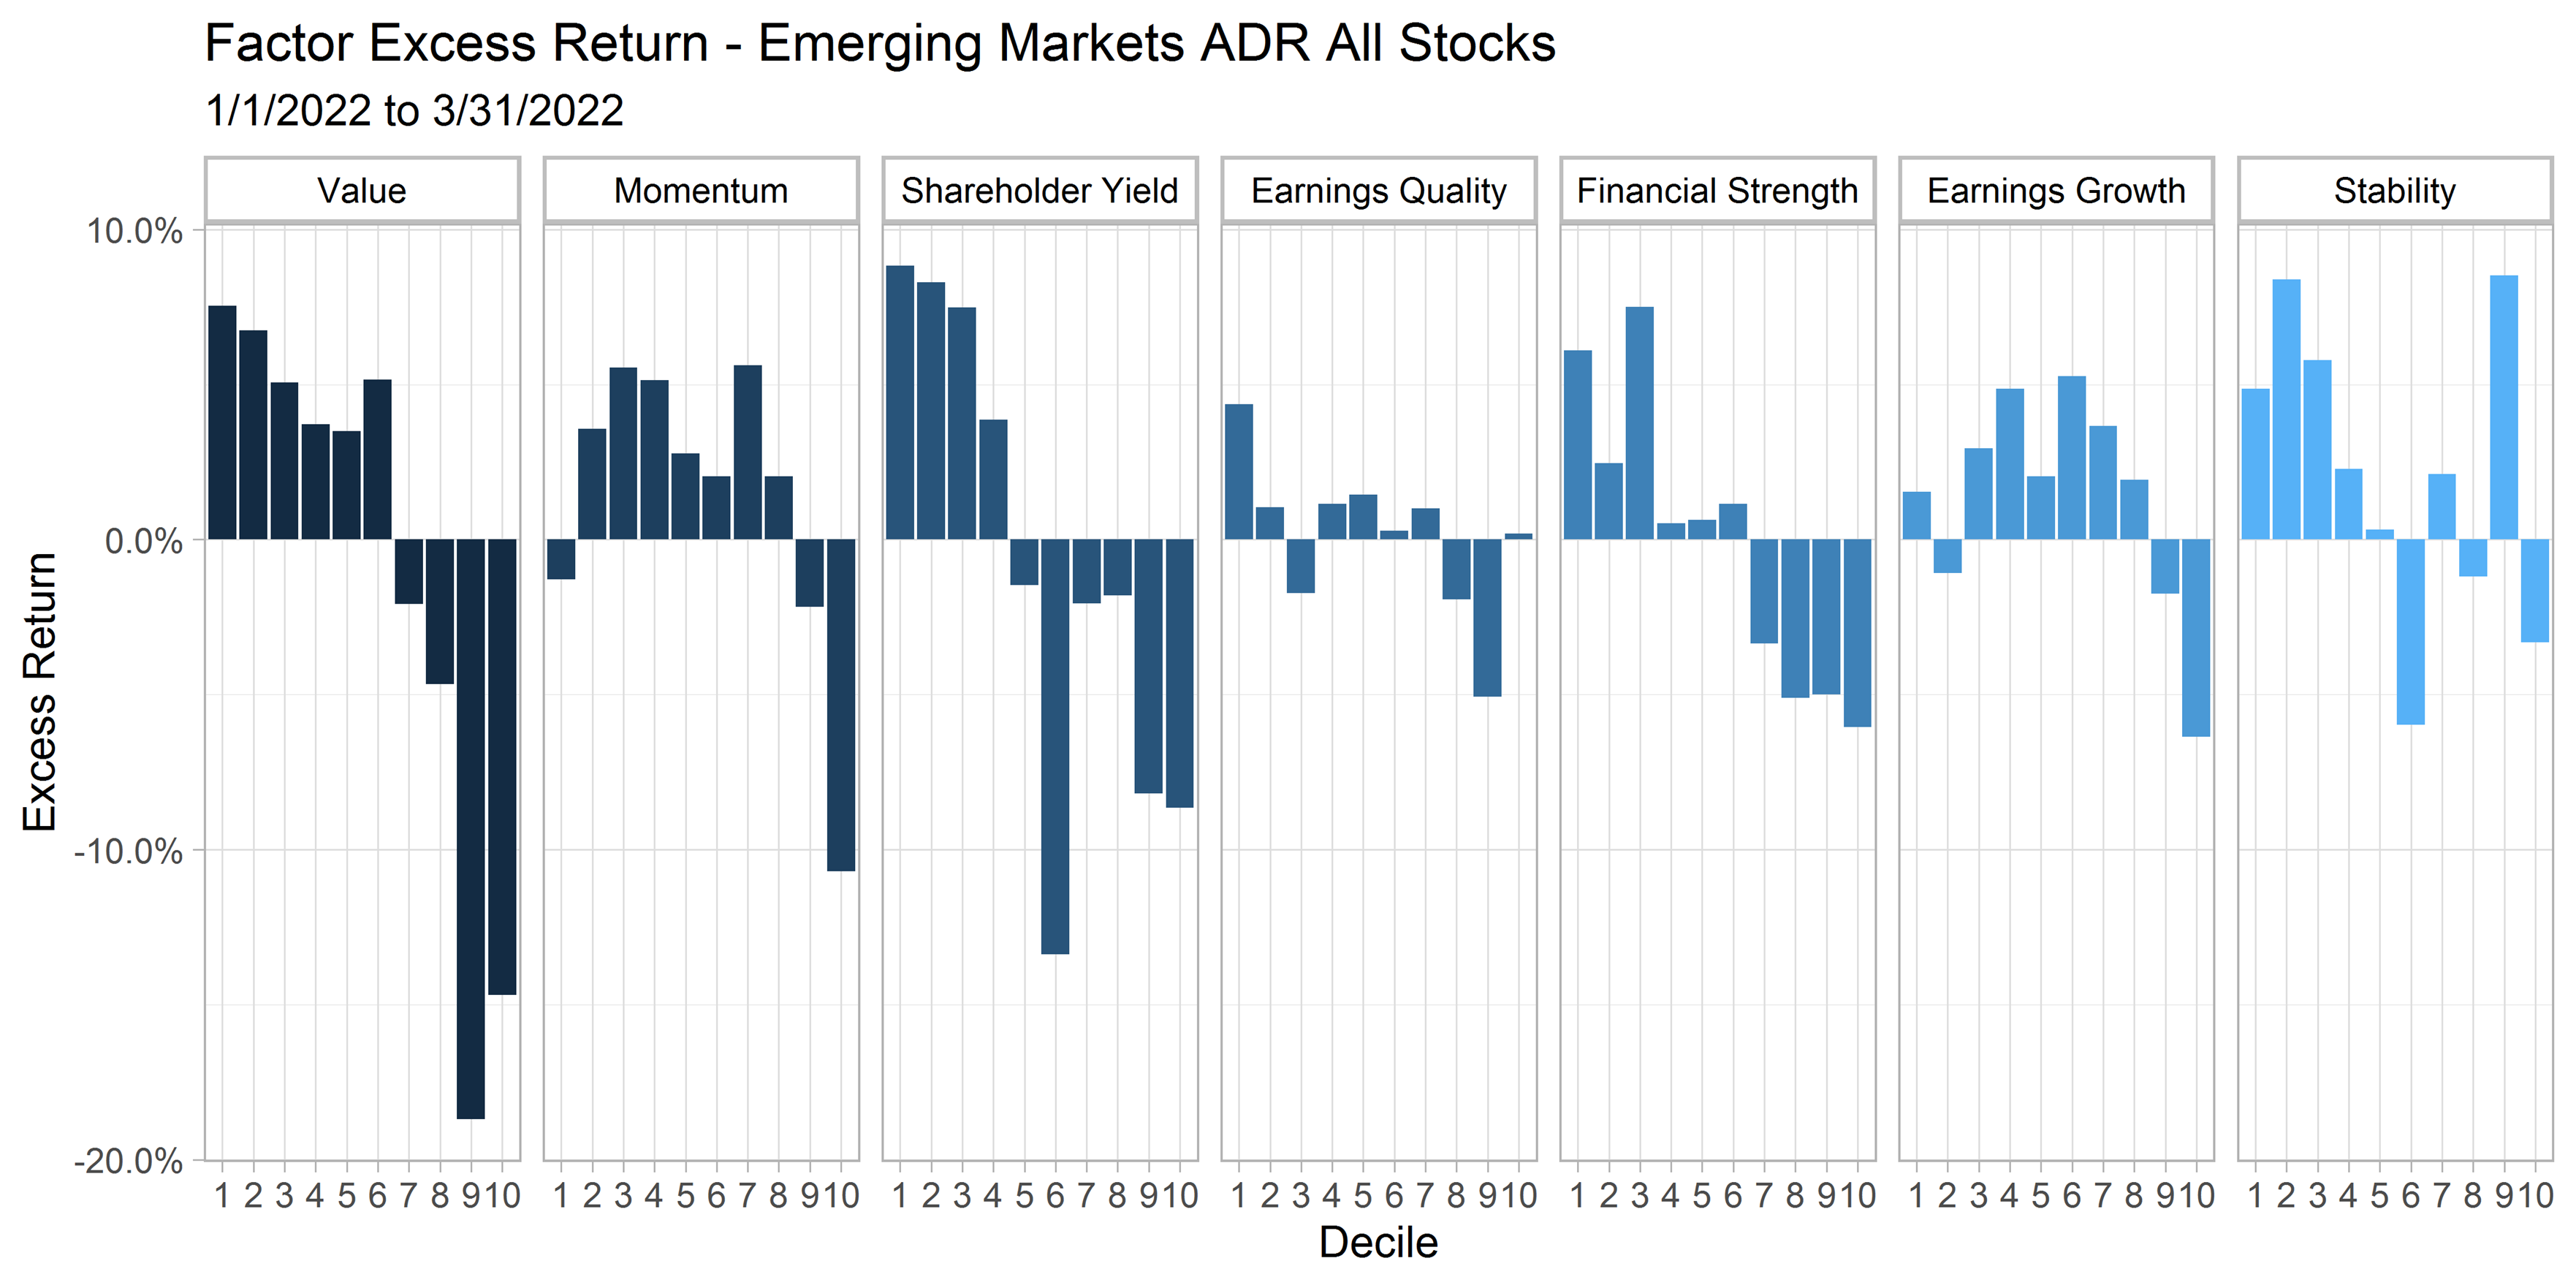
The charts below show the excess performance of the factor themes we monitor within each of our stock Universes. We think of Value, Momentum, and Shareholder Yield as selection factors—helping identify stocks we want to own and overweight for generating total return. Earnings Quality, Financial Strength, and Earnings Growth are quality factors that allow us to avoid stocks with non-cash driven earnings, weak balance sheets, and questionable underlying businesses. Stability is a selection factor for identifying stocks that tend to exhibit lower volatility and historically provide improved downside capture in drawdown. Column 1 for each of the panels represents the highest-ranking stocks on each factor while column 10 shows the lowest ranking. Historically, owning the highest ranked stocks and avoiding the lowest ranked stocks has resulted in successful investment outcomes.
U.S. Large Stocks
U.S. Small-Mid Stocks
Developed Markets ADR All Stocks
Emerging Markets ADR All Stocks
Dividend Growth
FOOTNOTES
1 The basket consists of 18 stocks within Consumer Staples, Health Care, and Consumer Discretionary sectors, equal-weighted on 1/1/2022.
2 The U.S. is grouped into deciles while non-U.S. is grouped into quintiles. Stocks with negative earnings are excluded from the analysis. Value spread is measured as a ratio of earnings-to-price for the cheap versus the expensive group in each market.
Important Legal, Canvas®, Hypothetical and/or Back-tested Disclosure Information
CANVAS® is an interactive web-based investment tool developed by O’Shaughnessy Asset Management, L.L.C. (“OSAM”) that permits an investment professional (generally a registered investment advisor or a sophisticated investor) to select a desired investment strategy for the professional’s client. At all times, the investment professional, and not OSAM, is responsible for determining the initial and ongoing suitability of any investment strategy for the investment professional’s underlying client. The professional’s client shall not rely on OSAM for any such initial or subsequent review or determination. Rather, to the contrary, at all times the professional shall remain exclusively responsible for same. See more about CANVAS below and Release and Hold Harmless at the end of this Important Disclosure Information.
Reliance on Investment Professional: OSAM has relied, and shall continue to rely, on the investment professional’s knowledge and experience to understand the inherent limitations of the performance presentation, including those pertaining to back-tested hypothetical performance. All performance presentations, including hypothetical performance, are the direct result of the investment professional’s request, independent of OSAM. Depending upon the investment professional’s direction and selection, hypothetical presentations can include both OSAM and non-OSAM Models and/or strategies. The below discussion as to the material limitations of back-tested hypotheticals apply to both OSAM and non-OSAM Models and/or strategies.
Intended Recipient: CANVAS content is intended for the investment professional only not to be shared with an underlying client unless in conjunction with a meeting between the investment professional and its client in a one-on-one setting. OSAM assumes that no hypothetical performance-related content will be provided directly to the professional’s client without the accompanying consultation and explanation of the professional. The content is intended to assist the professional in evaluating the appropriate investment strategy for the professional’s client.
OSAM Models. OSAM has devised various investment models (the “Models”) for CANVAS, the objectives of each are described herein. The investment professional is not obligated to consider or utilize any of the Models. As indicated above, at all times, the investment professional, and not OSAM, is responsible for determining the initial and ongoing suitability of any Model for the investment professional’s underlying client. Model performance reflects the reinvestment of dividends and other account earnings and are presented both net of the maximum OSAM’s investment management fee for the selected strategy and gross of an OSAM investment management fee. Please Note: As indicated at Item 5 of its written disclosure Brochure, OSAM’s CANVAS management fee ranges from 0.20% to 1.15%. The average percentage management fee for all CANVAS strategies is 0.36%. The percentage OSAM management fee shall depend upon the type of strategy and the corresponding amount of assets invested in the strategy; generally, the greater the amount of assets, the lower the percentage management fee. Please Also Note: The performance also do not reflect deduction of transaction and/or custodial fees (to the extent applicable), the incurrence of which would further decrease the performance. For example, if reviewing a strategy with a ten-year return of 10.0% each year, the effect of a 0.10% transaction/custodial fee would reduce the reflected cumulative returns from 10.0% to 9.9% on a 1-year basis, 33.1% to 32.7% on a 3-year basis, 61.1% to 60.3% on a 5-year basis and 159.4% to 156.8% on a 10-year basis respectively. Please Further Note: Transaction/custodial fees will differ depending upon the account broker-dealer/custodian utilized. While some broker-dealers/custodians do not charge transaction fees for individual equity (including ETF) transactions, others do. Some custodians charge fixed fees for custody and execution services. Choice of custodian is determined by the investment professional and his/her/its client. Higher fees will adversely impact account performance.
OSAM does not maintain actual historical performance results for the Models. In order to help assist the investment professional in determining whether a Model is appropriate for the professional’s client, OSAM has provided back-tested hypothetical (i.e., not actual) performance for the Model. OSAM, with minor deviations that it does not consider to be material*, currently uses the Models (i.e., live models vs. the reflected back-tested versions thereof) to manage actual client portfolios (see Model Deviations below). The performance reflects the current Model holdings, which are subject to ongoing change.
Material Limitations: The Performance is subject to material limitations. Please see Hypothetical/Material Limitations below. During any specific point in time or time-period, the Models, as currently comprised, performed better or worse, with more or less volatility, than corresponding recognized comparative indices, benchmarks or blends thereof.
Past performance may not be indicative of future results. Therefore, it should not be assumed that future performance of any specific investment or investment strategy (including the Models), will be profitable, equal any historical index or blended index performance level(s), or prove successful. Historical index results do not reflect the deduction of transaction and custodial charges, or the deduction of an investment management fee, the incurrence of which would have the effect of decreasing indicated historical performance results. The Russell 3000 is a market capitalization-weighted index of 3000 widely held large, mid, and small cap stocks. Russell chooses the member companies for the Russell 3000 based on market size and liquidity. The MSCI All Country World Index is a market capitalization weighted index designed to provide a broad measure of equity-market performance throughout the world. The MSCI is maintained by Morgan Stanley Capital International and is comprised of stocks from 23 developed countries and 24 emerging markets. The Barclays Capital Aggregate Bond Index is a market capitalization-weighted index, meaning the securities in the index are weighted according to the market size of each bond type. Most U.S. traded investment grade bonds are represented. Municipal bonds and Treasury Inflation-Protected Securities are excluded, due to tax treatment issues. The index includes Treasury securities, Government agency bonds, Mortgage-backed bonds, corporate bonds, and a small amount of foreign bonds traded in U.S. The historical performance results for the Russell 3000, MSCI and Barclays are provided exclusively for comparison purposes only, to provide general comparative information to help assist in determining whether a Model or other type strategy (relative to the reflected indices) is appropriate for his/her investment objective and risk tolerance. Please Also Note: (1) Performance does not reflect the impact of client-incurred taxes; (2) Neither Model or the selected strategy holdings correspond directly to any such comparative index; and (3) comparative indices may be more or less volatile than the Model or selected strategy.
Hypothetical/Material Limitations-performance reflects hypothetical back-tested results that were achieved by means of the retroactive application of a back-tested portfolio and, as such, the corresponding results have inherent limitations, including: (a) the performance results do not reflect the results of actual trading using investor assets, but were achieved by means of the retroactive application of the Model or strategy (as currently comprised), aspects of which may have been designed with the benefit of hindsight; (b) back tested performance may not reflect the impact that any material market or economic factors might have had on OSAM’s (or the investment professional’s) investment decisions for the Model or the strategy; and, correspondingly; (c) had OSAM used the Model to manage actual client assets (or had the investment professional used the selected strategy to manage actual client assets) during the corresponding time periods, actual performance results could have been materially different for various reasons including variances in the investment management fee incurred, transaction dates, rebalancing dates (increases account turnover), market fluctuation, tax considerations (including tax-loss harvesting-increases account turnover), and the date on which a client engaged OSAM’s investment management services.
MORE ABOUT CANVAS®
CANVAS® is an interactive web-based investment tool developed by O’Shaughnessy Asset Management, L.L.C. (“OSAM”) that permits an investment professional (generally a registered investment advisor or a sophisticated investor) to select a desired investment strategy (the “Strategy”) for the professional’s client. At all times, the investment professional, and not OSAM, is responsible maintaining the initial and ongoing relationship with the underlying client and rendering individualized investment advice to the client. In addition, the investment professional and not OSAM, is exclusively responsible for:
- determining the initial and ongoing suitability of the Strategy for the client;
- devising or determining the specific initial and ongoing desired Strategy;
- monitoring performance of the Strategy; and,
- modifying and/or terminating the management of the client’s account using the Strategy.
Hypothetical Limitations: To the extent that the investment professional seeks for CANVAS to provide hypothetical back-tested performance, material limitations apply-See above.
Model Deviations: As indicated above, OSAM, with minor deviations that it does not consider to be material*, currently use the Models to manage actual client portfolios (i.e., the live Models). The deviations include:
- the use of proxies if and when an ETF used in the back-test was not available*. While the back-tested and live strategies both utilize the same investment themes, back-tested proxies can deviate from live models based on limitations of historical information;
- back-tested data presented utilizes a month-end rebalance while actual live model performance reflects intra-month rebalances;
- OSAM, as a discretionary manager, can update its live models as determined necessary. These changes will then be applied retroactively to back-tested models, the resulting performance of which would be different than that of the actual historical models-see Hypothetical/Material Limitations above; and,
- Financial statement information may be restated over time, which information was not reflected in the historical back-tested models. Companies will also have mergers and acquisitions or other corporate events that can retrospectively affect the names and corporate identities of organizations in the historical back-tests. Data providers providing pricing and return information may update historical data upon discovering deficiencies or omissions.
Strategy Sampling Impact: The implementation of OSAM strategies utilize a sampling of the underlying individual Strategy positions, and, as the result thereof, the underlying securities’ weighting could unintentionally deviate +/- the Strategy allocation target OSAM calculates the CANVAS fees based on the mix of strategies that are utilized at the establishment of the account. Therefore, the sampling approach can cause deviations between the Canvas strategy allocation establishment (and its corresponding fee) and the implementation of that CANVAS strategy.
ESG Portfolios/Socially Responsible Investing Limitations. To the extent applicable to the strategy chosen by the investment professional, Socially Responsible Investing involves the incorporation of Environmental, Social and Governance considerations into the investment due diligence process (“ESG). There are potential limitations associated with allocating a portion of an investment portfolio in ESG securities (i.e., securities that have a mandate to avoid, when possible, investments in such products as alcohol, tobacco, firearms, oil drilling, gambling, etc.). The number of these securities may be limited when compared to those that do not maintain such a mandate. ESG securities could underperform broad market indices. Investors must accept these limitations, including potential for underperformance. Correspondingly, the number of ESG mutual funds and exchange-traded funds are few when compared to those that do not maintain such a mandate. As with any type of investment (including any investment and/or investment strategies recommended and/or undertaken by OSAM), there can be no assurance that investment in ESG securities or funds will be profitable or prove successful.
Tax Management Function: When requested by the investment professional, OSAM will use best efforts to work within Onboarding Budgets, Annual Tax Budgets, and Tracking Error Budgets. However, market and/or specific stock price fluctuations can occur quickly and can correspondingly adversely affect our ability to manage to specified budgets. Additionally, changes to tax budgets, cash flows in and out of an account, mandatory corporate actions, and funding with securities can also impact preciseness. The investment professional must accept this risk. In addition:
- OSAM has not, and will not, verify the accuracy of any tax-related information provided;
- In the event that any such information provided is inaccurate or incomplete, the corresponding results will be inaccurate or incomplete;
- Tracking Error Budgets are relative to the Model, not the benchmark;
- OSAM is not a CPA and this is not tax advice;
- Tax laws and rates change;
- While we seek to follow the investment professional prescribed target models, ranges, timeframes, tax budgets, and seek not to create wash sales or exceed expected tax budgets, there can be no assurance that the CANVAS tool will be able to accurately do so;; and,
- For specific personalized tax-related advice, consult with a CPA or other tax professional.
Fixed Income ETF Model-The models are constructed using passive fixed income ETFs. The models attempt to target varying levels of duration and credit exposure relative to the Barclays Aggregate Index. The expense ratios of the underlying ETF’s are born by the investor and are separate and apart from CANVAS related fees.
Miscellaneous Limitations/Issues:
- Results in the Transition Portal reflect expense ratios corresponding to the specific funds indicated/provided by the investment professional. Expense ratios are provided by an unaffiliated database. Results also reflect projected future yields corresponding to such current indicated funds. Such data may not be precise;
- The risk-free rate used in the calculation of Sortino, Sharpe, and Treynor ratios is 5%, consistently applied across time;
- OSAM did not begin to offer CANVAS until April 2019. Prior to 2007, OSAM did not manage client assets; and,
- A copy of OSAM’s written disclosure Brochure, Form CRS and Privacy Notice remains available on this CANVAS website or at www.osam.com.
Release and Hold Harmless
The professional, to the fullest extent permitted under applicable law, agrees to release, defend, indemnify and hold OSAM (including its officers, directors, members, owners, employees, agents, and affiliates) harmless from any and all adverse consequences, financial or otherwise, of any type or nature arising from or attributable to the professional’s access to, and use of, CANVAS, including, but not limited to, any claims for alleged or actual client losses or damages of any kind or nature whatsoever (including without limitation, the reimbursement of reasonable attorney’s fees, costs and expenses incurred by OSAM relating to investigating or defending any such claims and/or demands), except to the extent that actual losses are the direct result of an act or omission by OSAM that constitutes willful misfeasance, bad faith or gross negligence as adjudged by a court of final jurisdiction.
*except in the unlikely event that the performance of the proxy used in lieu of the actual ETF was materially different (positive or negative)
Lastly, please be advised, without limitation, OSAM shall not be liable for Losses resulting from or in any way arising out of (i) any action of the investor or its previous advisers or other agents, (ii) force majeure or other events beyond the control of OSAM, including without limitation any failure, default or delay in performance resulting from computer or other electronic or mechanical equipment failure, unauthorized access, strikes, failure of common carrier or utility systems, severe weather or breakdown in communications not reasonably within the control of OSAM, inaccuracy or incompleteness of any third-party data, or other causes commonly known as “acts of God,” or (iii) general market conditions. Under no circumstances shall OSAM be liable for consequential, special, incidental or indirect damages, punitive damages, or lost profits or reputational harm. Additionally, the responsibility solely rests on the “master user” of CANVAS at each independent firm, and NOT OSAM, to close out any associated users who may terminate at any time.
O’Shaughnessy Asset Management, LLC (OSAM) is a wholly owned subsidiary of Franklin Resources Inc./(Franklin Templeton).