Canvas Q4 Commentary
By OSAM Research TeamFebruary 2022
Key Points:
• Equities posted a strong finish for the 2021 calendar year, despite digesting the Federal Reserve’s hawkish pivot on rate hikes and the new COVID-19 Omicron variant.
• Our key selection factors had consistent performance across investment universes for the quarter and year. Value and Shareholder Yield outperformed in both Q4 and the calendar year for all universes. Momentum outperformed in both periods within the International ADR universe, but underperformed for the calendar year in our US universes (US Large & US Small-Mid).
• Lower market cap stocks generally underperformed on the quarter and year across universes, which was a headwind for factor allocations relative to cap-weighted indexes.
• Stocks ranking highly on our Stability theme—those with stability in sales, earnings, share issuance, and price volatility—generally outperformed for the quarter and year. Stocks with strong Dividend Growth outperformed on the year. Dividend Growth generally lagged on the quarter except within Small-mid cap stocks where it outperformed.
2021 Developments
2021 was a particularly remarkable year for the twists and turns it presented. As the 2-year anniversary of COVID-19 approaches, the themes driving equity markets remain largely unchanged. Investors are still digesting economic and policy developments around the global recovery and monitoring the everchanging public health risks associated with COVID-19. While markets continued trending higher in 2021 on the back of recovery tailwinds, new COVID-19 variants produced intermittent bouts of volatility. Record case numbers stemming from the Omicron variant commanded attention at year end, although deaths and hospitalizations stayed below the prior Alpha and Delta variant peaks.
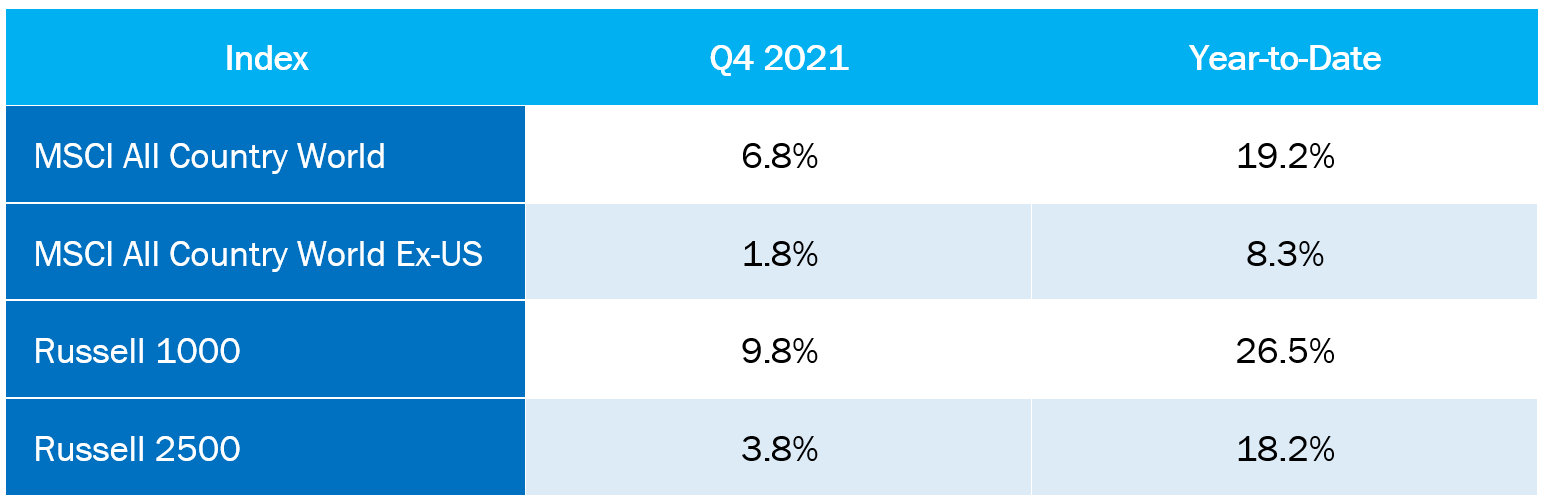
In markets, U.S. Large Cap stocks dominated the global equity rally in 2021. The S&P 500 index ended December with a roughly 30% gain for the year. Energy and Real Estate led performance at the sector level, as oil prices approached $80 per barrel and home prices reached all-time highs. Property market strength was also reflected by strong REIT returns. Communication Services, Consumer Staples and Utilities stocks lagged.
Mega cap technology was a notable contributor to stock market gains in 2021, with seven companies’ market caps surpassing $1T (at least temporarily) during the year. Microsoft passed $2T in June, Alphabet hit the multi-trillion-dollar mark in November, and Apple became the first $3T company on the opening trading day of 2022. By year end, the aggregated market value of Apple, Microsoft, Alphabet, Amazon, Tesla and Meta Platforms (formerly Facebook) reached approximately $12.4T, larger than the entire S&P 500’s capitalization a decade earlier.
Smaller companies and developed market stocks significantly underperformed U.S. large caps, trailing the S&P 500 by 14% and 20% for the year, respectively. Small cap growth stocks and emerging markets equities were particularly weak on a relative basis, trailing by around 26% and 34%, respectively.
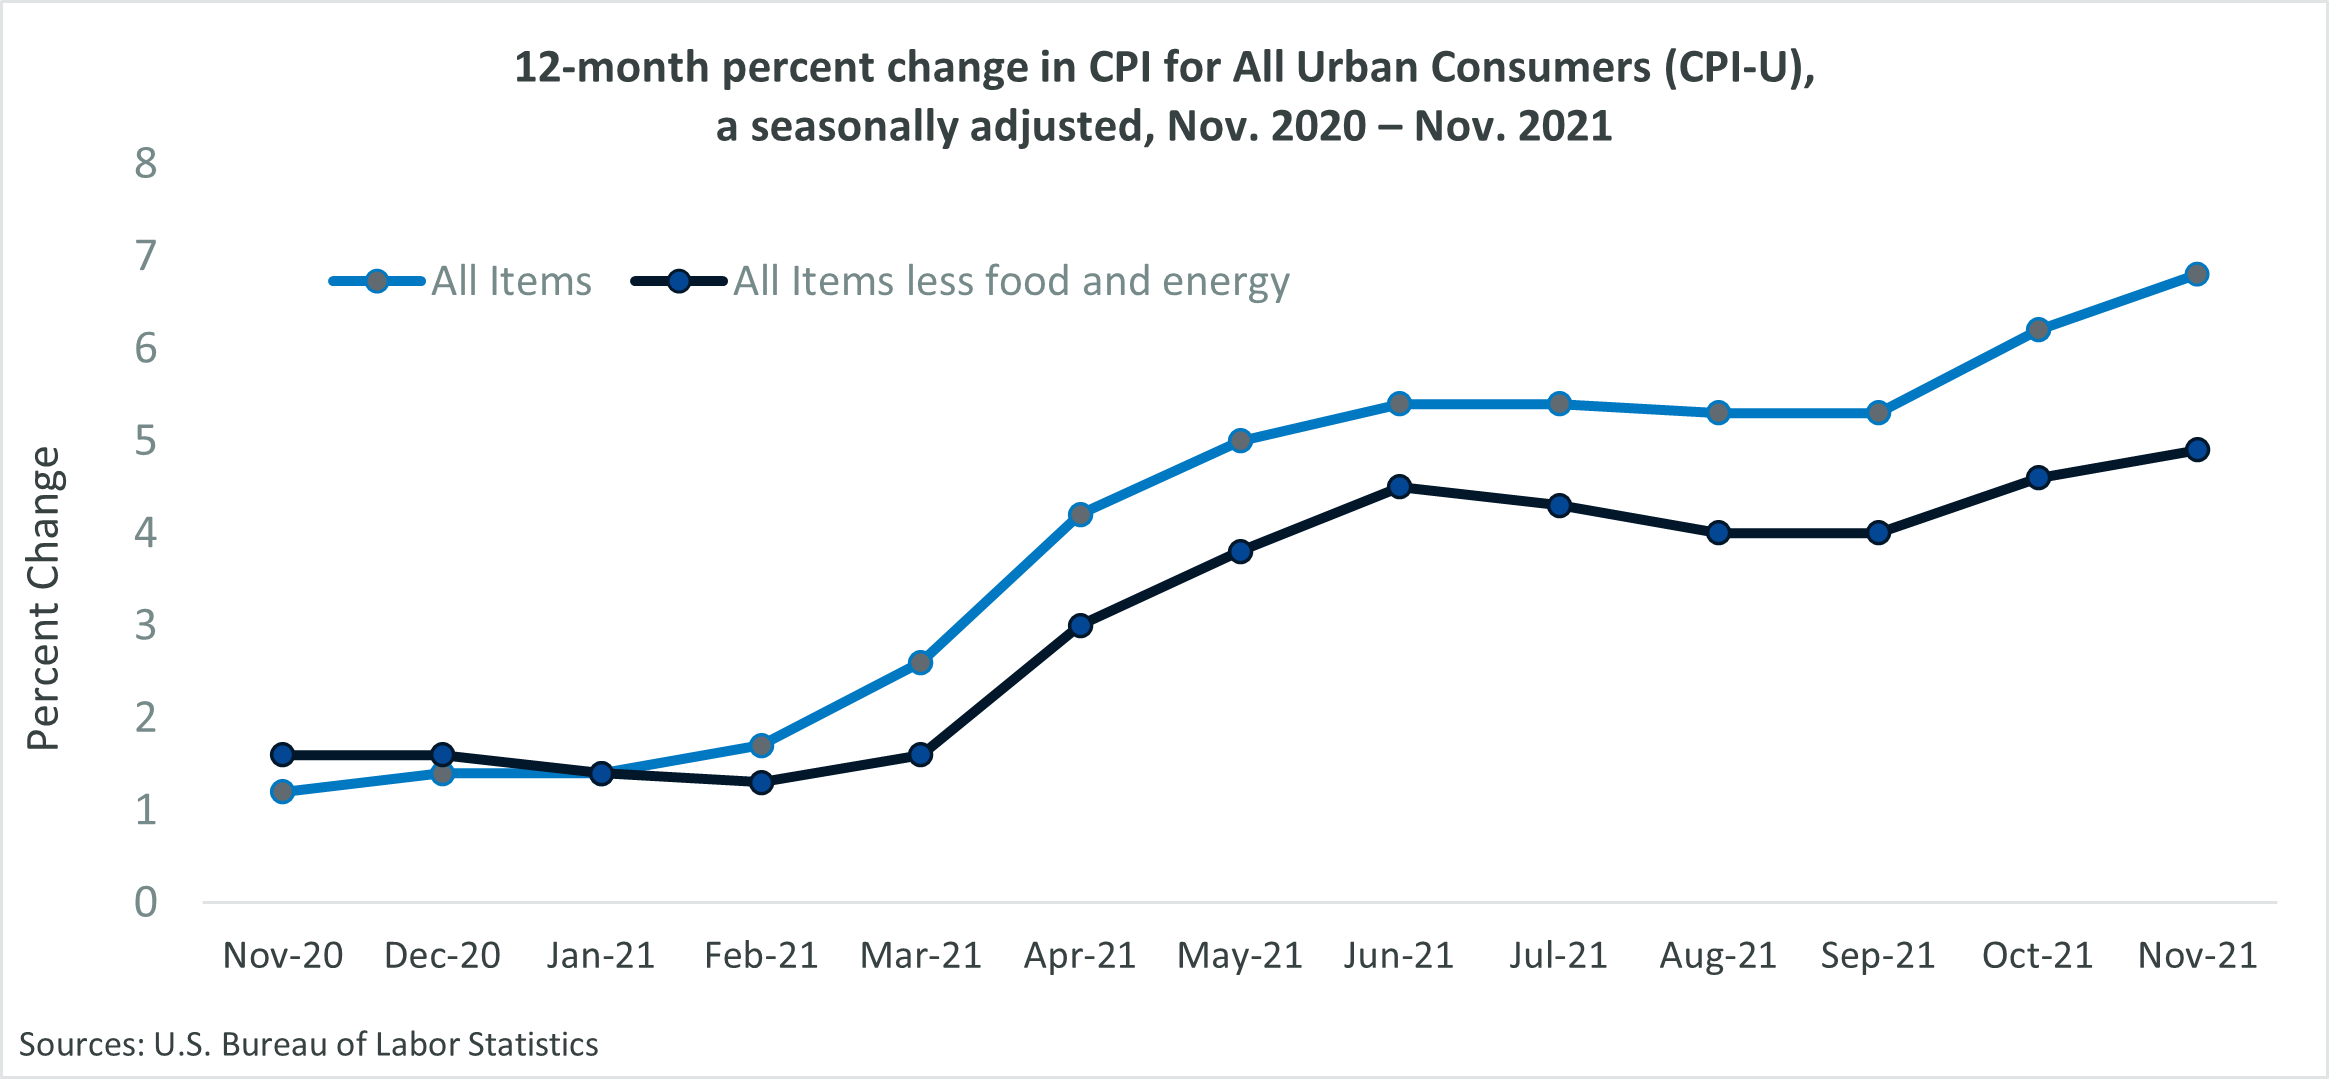
Investors focused on inflation in the fourth quarter as supply chain disruptions caused core inflation to meaningfully exceed the Federal Reserve’s 2% target. Having slowed during the summer months, CPI readings of 0.9% in October and 0.8% in November signaled mounting inflationary pressures.

The All-Items index rose 6.8% year over year in November – the highest since 1982 – and rose 4.9% when excluding food and energy prices. While CPI remains the media’s go-to data point on inflation, the Federal Reserve’s preferred Personal Consumption Expenditures Index (PCE) told a similar story.
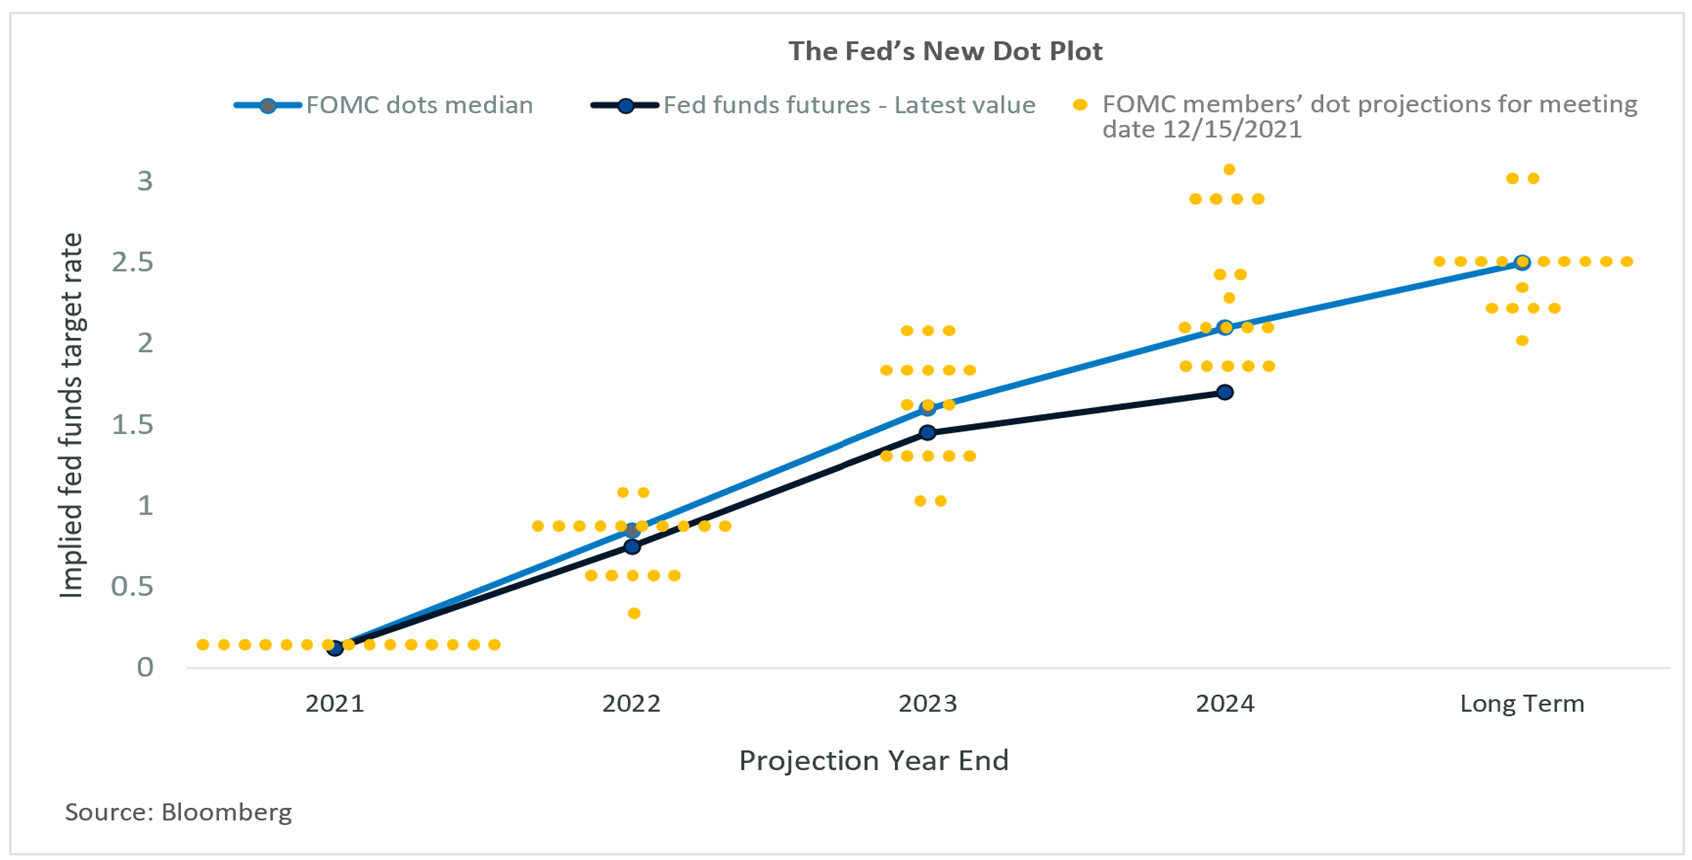
In August, Federal Open Market Committee (FOMC) meeting minutes showed taper-talk ratcheting up. Around the same time, Fed Chair Jerome Powell stated at the virtual Jackson Hole meeting that the central bank would begin tapering bond purchases in 2022 but warned against reacting too quickly to recent inflation. By September, however, FOMC minutes showed an increasingly hawkish stance; which was confirmed in December when the Fed signaled a departure from the ultra-easy monetary policy in place since March 2020. Monthly bond purchases were reduced to $60B from January 2022, half the pre-November level, and will fall further as the new year progresses. Regarding interest rates, December dot plots showed that 12 of 18 FOMC members saw three or more increases in 2022, and no members believed rates would remain anchored around zero.
The CME Group’s rate hike estimation, calculated by adding the probabilities of all target rate levels above the current target rate from the corresponding CME Group Fed Fund futures contracts, shows a 53.7% chance a 25-50 basis point target rate by the May 4th meeting, and 77.6% probability of a 50-75 bp or higher target rate by December 14th.
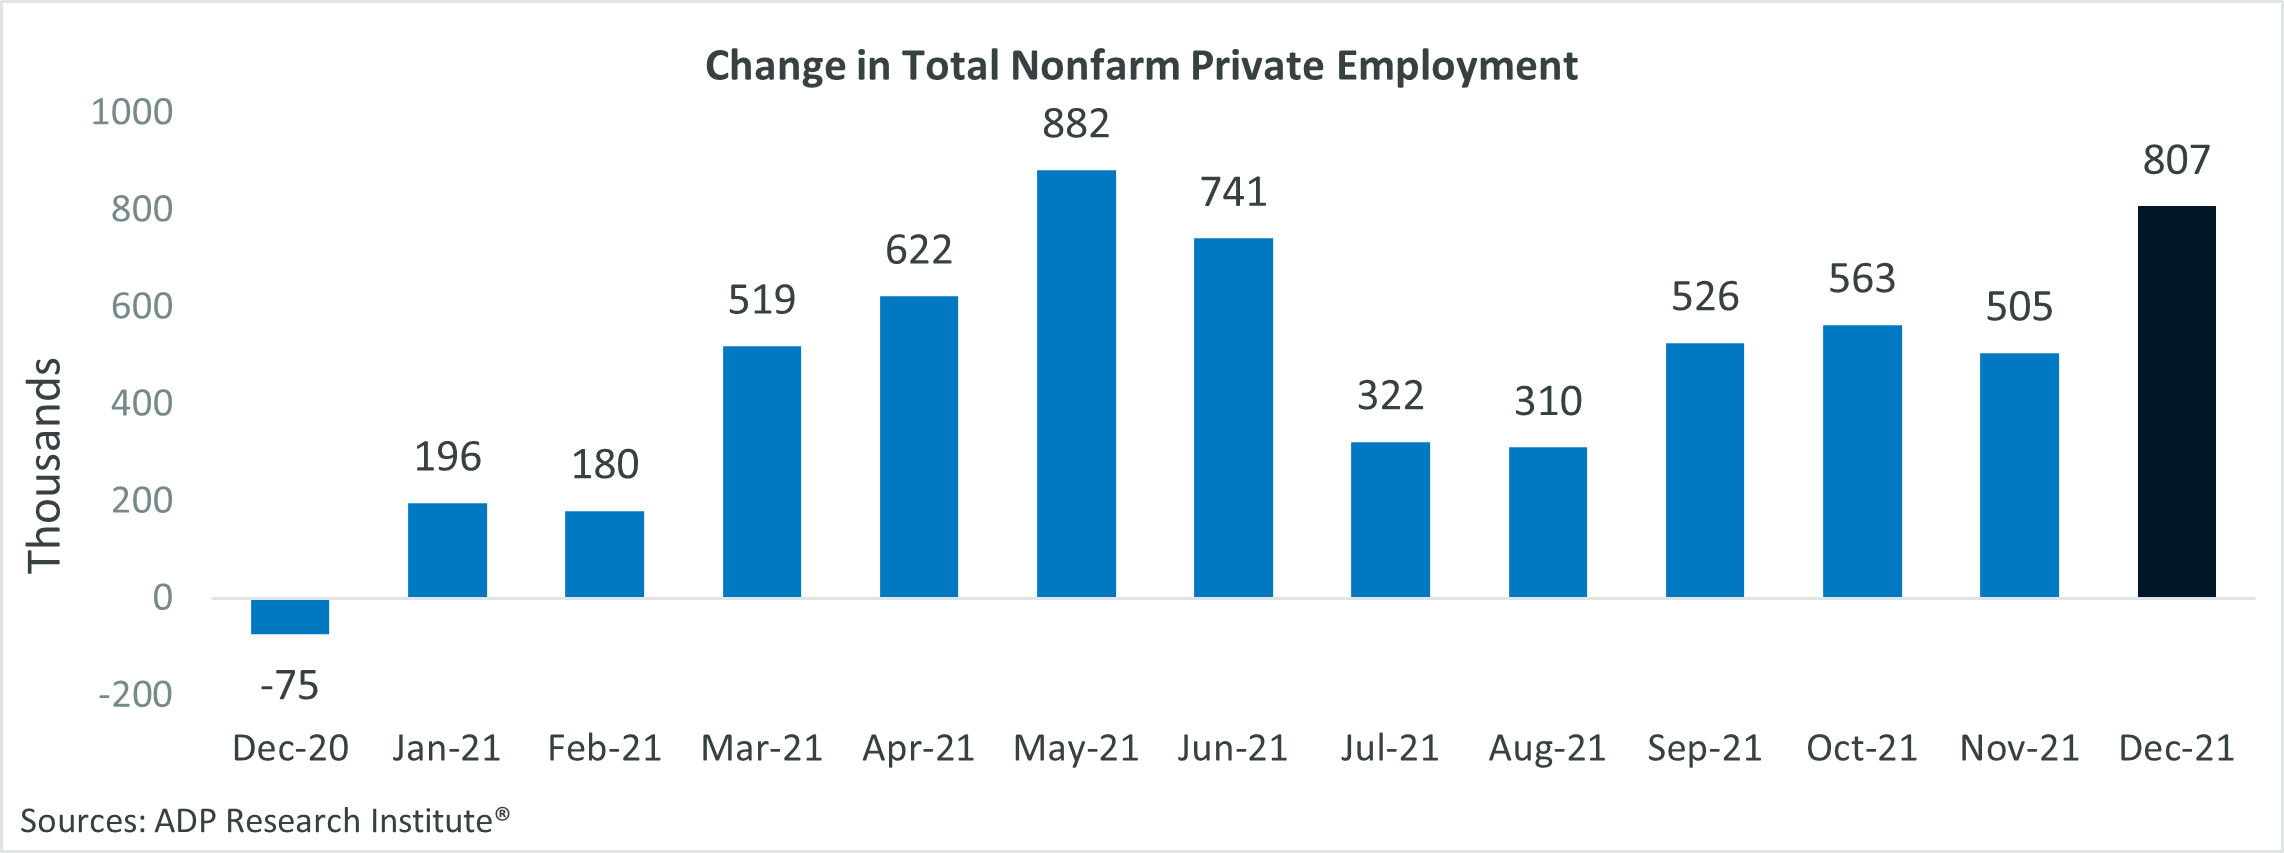
A continued resurgence in the labor market also seemed to support a tighter monetary policy. December 25th weekly jobless claims were 198k, with a 4-week rolling average of 199.25k. This was the lowest reading for this average since October 25, 1969, and was sharply lower than the pre-pandemic rolling average of 225.5k set on March 14th, 2020. ADP private non-farm payrolls increased by 807k in December, with a large proportion of these gains coming from the leisure and hospitality industry, as employment growth accompanied the continued roll-out of vaccines and the relaxation of local and state-wide regulations around public gatherings, events and travel.
Despite this job growth, a record 4.5 million U.S. workers quit their jobs in November. And while ADP data showed 6 million jobs added in 2021, private-sector payrolls were still nearly 4 million lower than pre-pandemic levels. In December, the Bureau of Labor Statistics reported a 0.3% fall in the unemployment rate, to 3.9%, as well as a 483k fall in the number of unemployed individuals, to 6.3 million. While both figures were down significantly from their April 2020 highs, they remained elevated when compared to their pre-pandemic-lockdown levels of 3.5% and 5.7 million, respectively.
2021 Factor Performance
From a factor perspective, we distilled 2021 down into three periods—an early reflationary trend that gave way to a period of uncertainty, which was followed by breathless anticipation of monetary policy response.
We incorporated a new tool—machine learning—to evaluate what drove performance during these periods. At the outset of each period, we used a classification algorithm to segment the market into four groups based only on their fundamental characteristics. We then tracked performance of the four groups to measure the spread between the highest and lowest performing.
Below are the three periods, the core macro driver that influenced the market, the characteristics of top and bottom performing groups within U.S. Large Stocks, and the performance spread between the two:
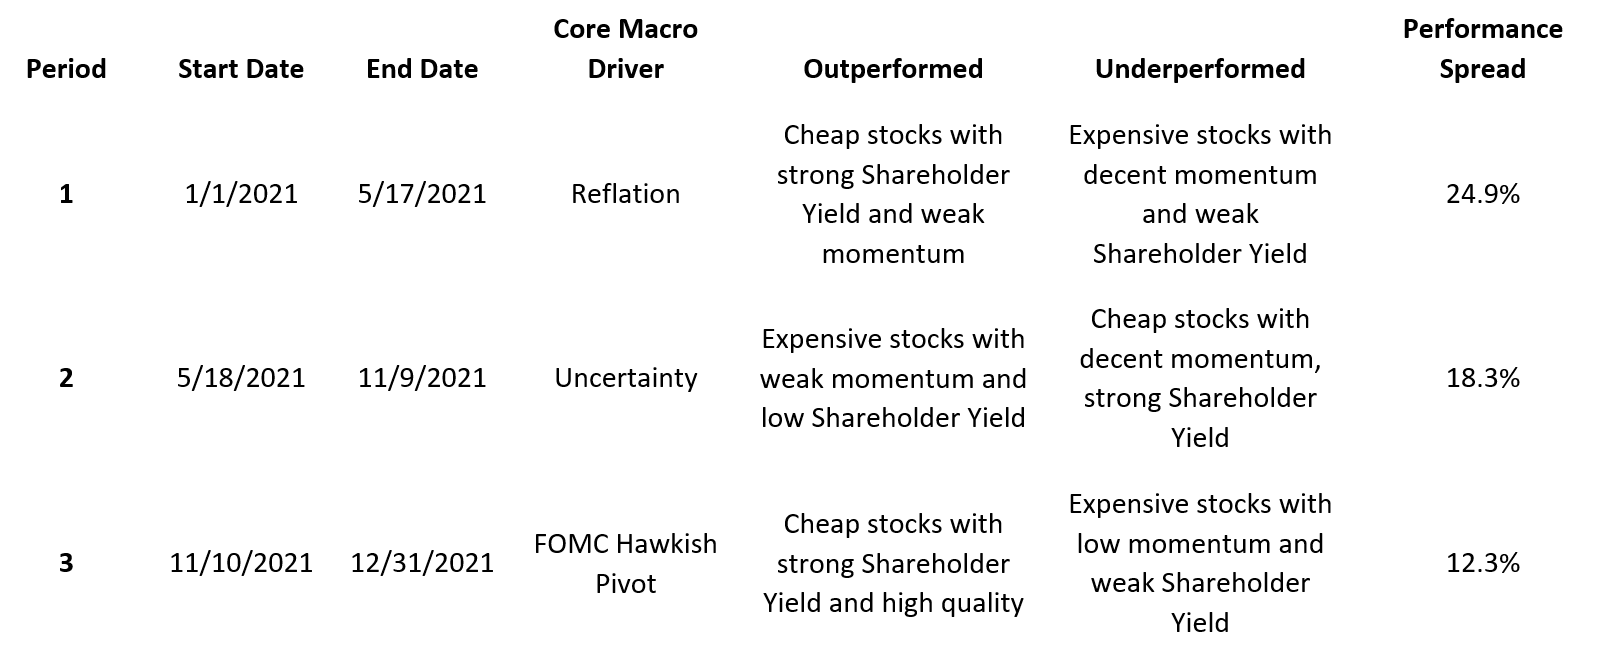
Across the periods, the most important determinants of performance were Value and Shareholder Yield. Portfolios oriented towards cheap names with strong Shareholder Yield did quite well on the year. Momentum was a strong laggard, which is not a surprise given the rotations that occurred. Momentum tends to struggle in such environments.
As can be gleaned from the performance spread column above, performance dispersion was high at the outset of the year and gradually came down into year-end as monetary policy response came front and center.
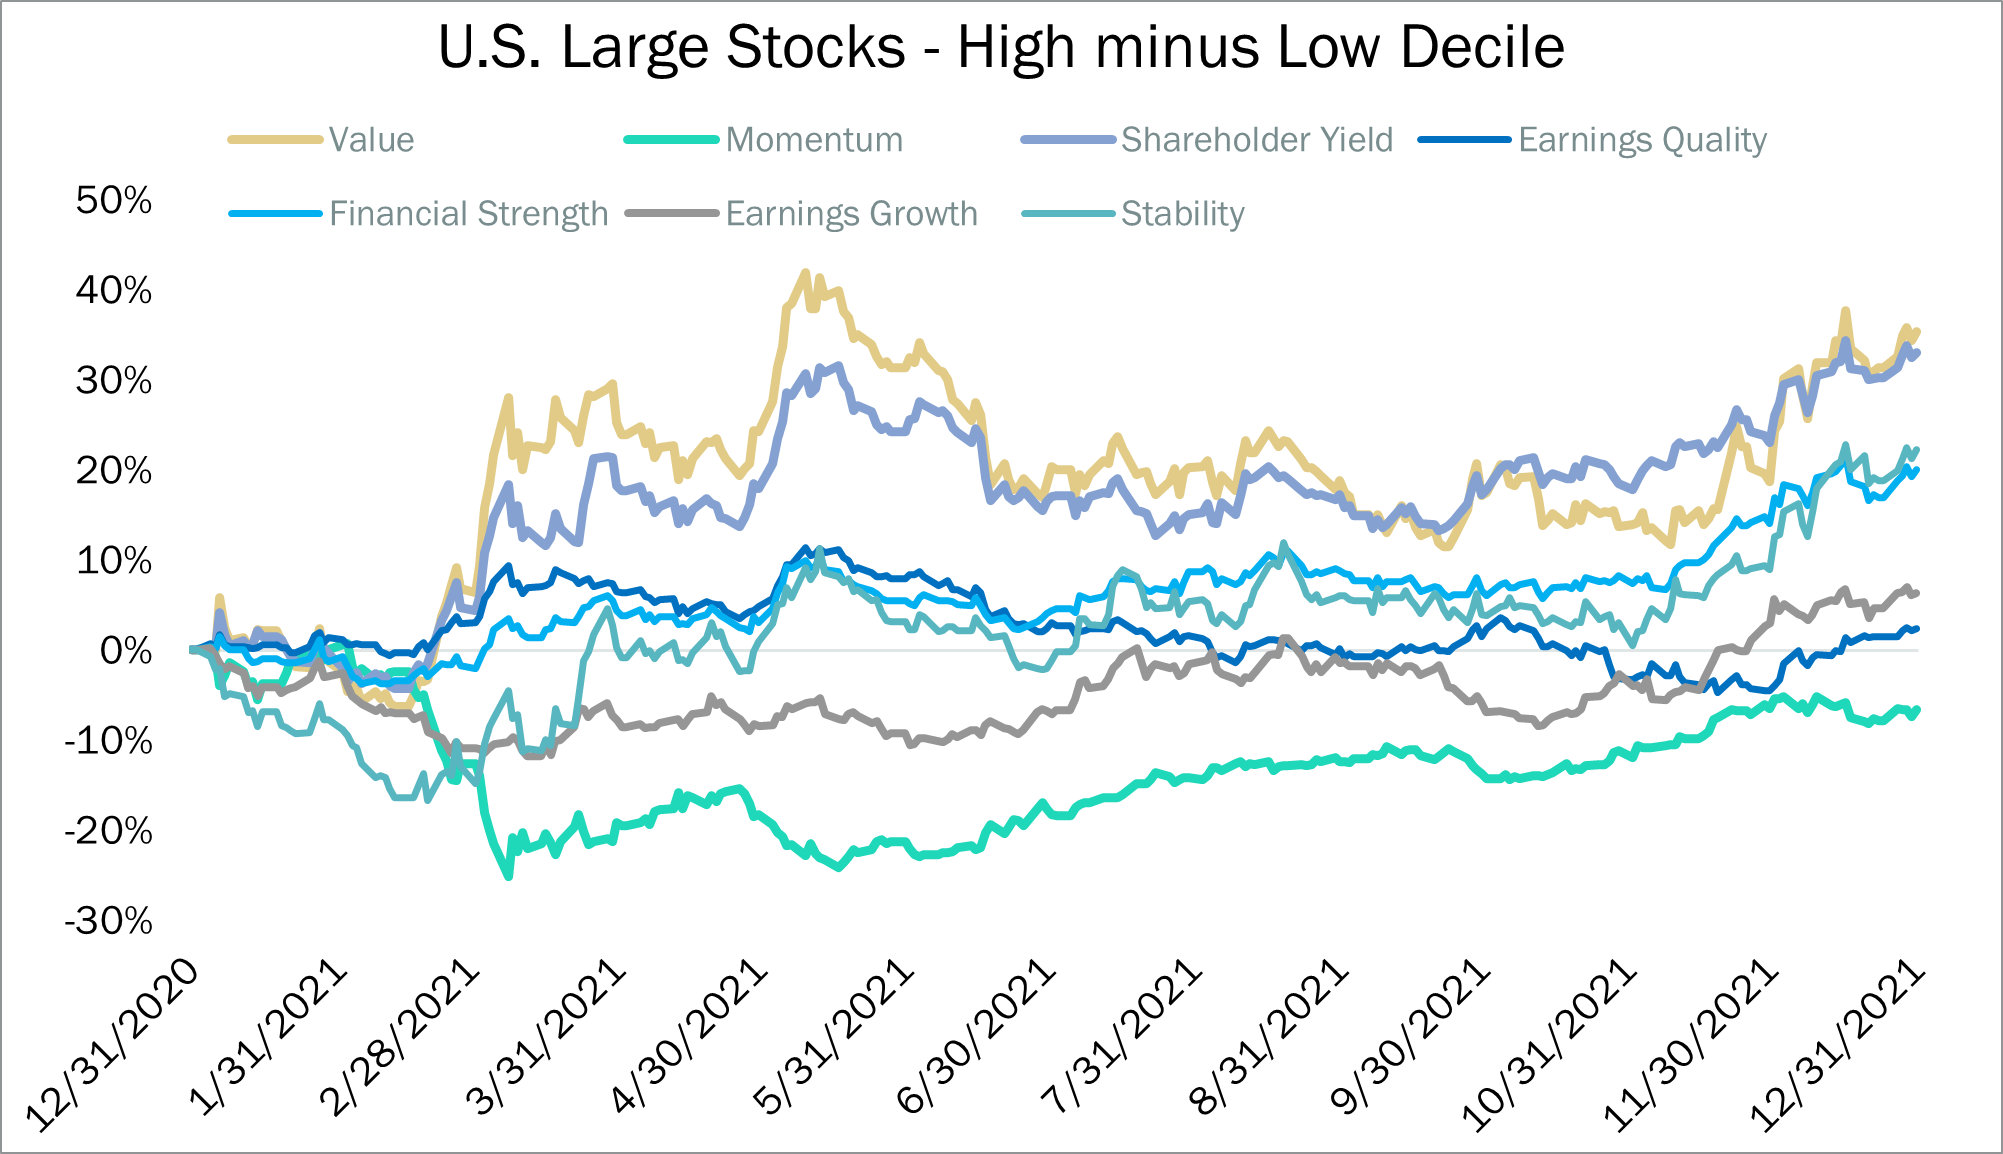
It is interesting to note also that quality became more important in the latter portion of the year, suggesting a defensive posture on the part of investors. This can be seen at the right side of the chart below, which shows the time series of cumulative performance of our factors in 2021.
U.S. Large Stocks
The panel below shows the excess performance of the six factor themes we monitor within U.S. large cap stocks. We think of Value, Momentum, and Shareholder Yield as selection factors—helping identify stocks we want to own and overweight. Earnings Quality, Financial Strength, and Earnings Growth are quality factors that allow us to avoid stocks with non-cash driven earnings, weak balance sheets, and questionable underlying businesses. Column 1 for each of the panels represents the highest-ranking stocks on each factor while column 10 shows the lowest ranking. Historically, owning the highest ranked stocks and avoiding the lowest ranked stocks has resulted in successful investment outcomes.
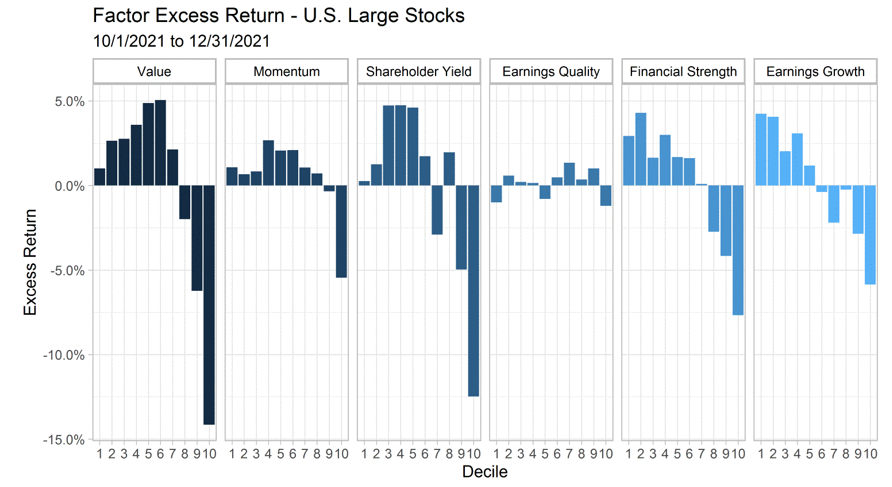
As you can tell from the chart above, factors posted consistent performance for the quarter, with all three of our selection factors outperforming. Shareholder Yield lagged behind Momentum and Value.
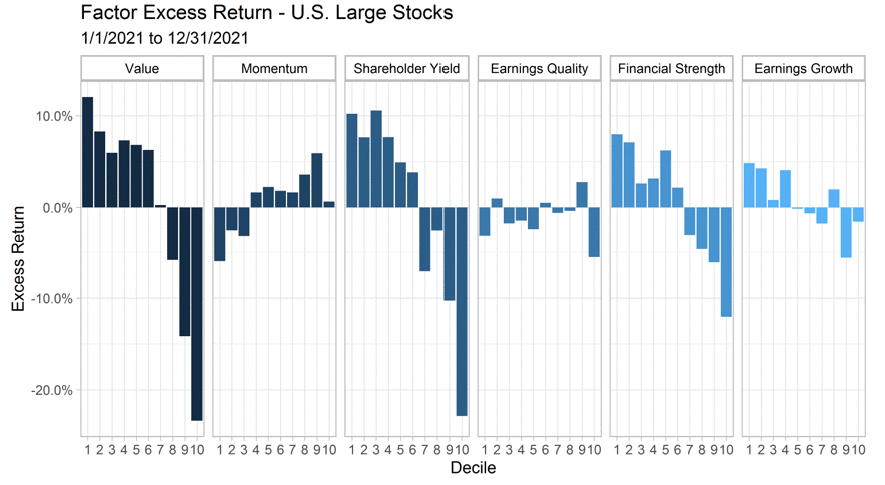
The chart below shows factor performance year to date. Value and Shareholder Yield have substantially outperformed on the full year, while Momentum has lagged. The quality themes had mixed performance. Financial Strength was a standout on the quality front. This is no surprise given the prospect of rising rates into year end. In a rising rate environment, over-levered stocks tend to underperform historically.
U.S. Small-Mid Stocks
The panel below shows the excess performance of the five factor themes we monitor within U.S. Small-Mid Cap stocks. Column 1 for each of the panels represents the highest-ranking stocks on each factor while column 10 shows the lowest ranking. Historically, owning the highest ranked stocks and avoiding the lowest ranked stocks has resulted in successful investment outcomes.
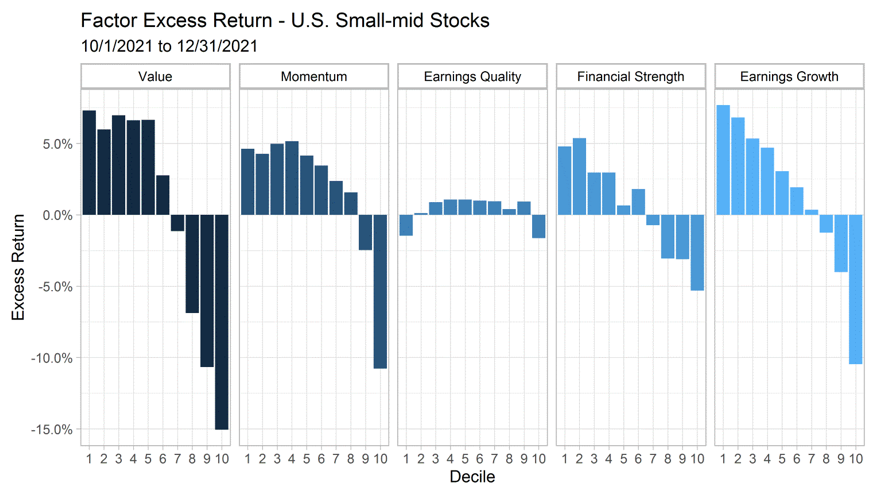
Within the Value factor, cheaply priced stocks (column 1) outperformed expensive (also known as “growth”) stocks (column 10) by about 22% during the quarter—continuing to unwind growth’s outperformance from 2020.
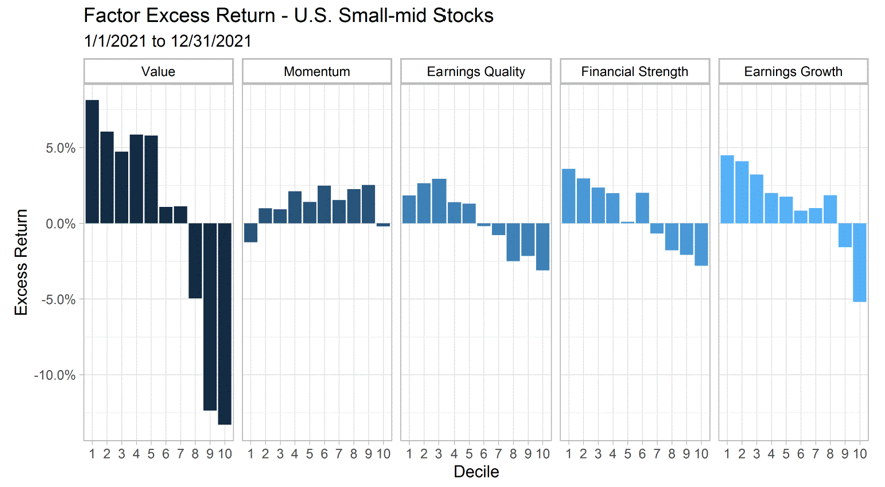
However, the year-to-date return profile for Value and Momentum continues to be very similar to that seen in U.S. Large Stocks—cheap value outperforming and strong momentum underperforming. The quality picture is consistent, with poorer quality stocks underperforming.
International ADR Stocks
The panel below shows the excess performance of the six factor themes we monitor within ADR All Stocks. The universe includes developed and emerging markets.
Emerging markets peaked around mid-February, which roughly coincided with a low in the trade-weighted dollar. Contrary to most expectations, USD strengthened about 6% from that point into the close of the year, which took the wind out of EM’s sails all year long. On the chart below, column 1 for each of the panels represents the highest-ranking stocks on each factor while column 10 shows the lowest ranking. Historically, owning the highest ranked stocks and avoiding the lowest ranked stocks has resulted in successful investment outcomes.
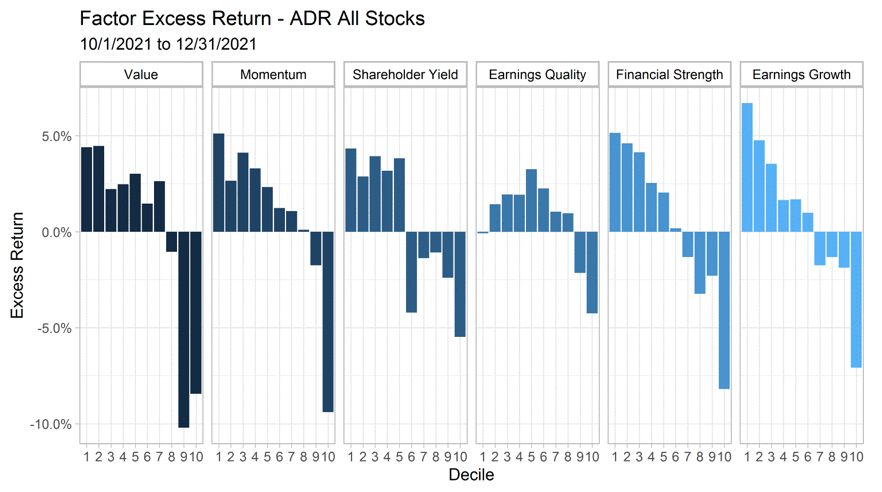
Within the Value factor, cheaply priced stocks (column 1) outperformed expensive (also known as “growth”) stocks (column 10) during the quarter, similar to what we saw in the U.S. Momentum performed in line with long-term historical norms with the highest Momentum decile outperforming. Shareholder Yield tends to be aligned with Value and, in fact, performed similarly on the quarter. Poor quality names generally underperformed on the quarter.
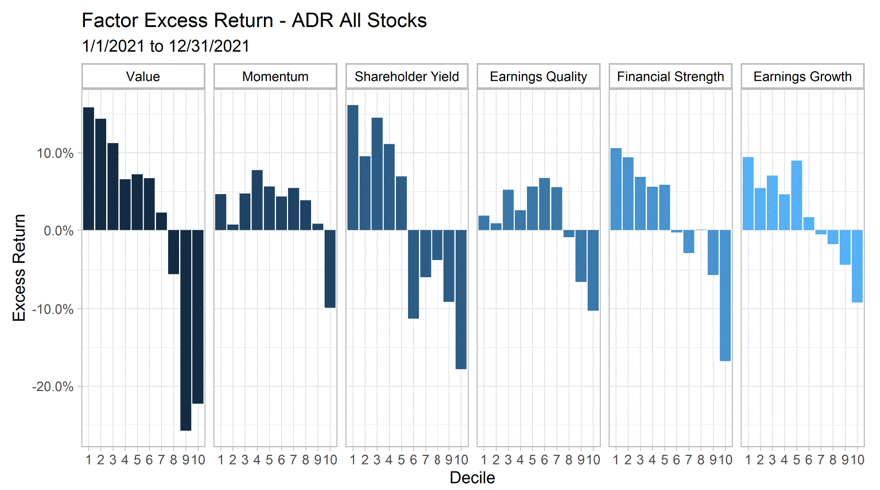
On the year, the return profile for Momentum is different than what we saw in U.S. Large Stocks, with strong momentum outperforming in the International ADR universe. Value and Shareholder Yield performed in line with U.S. Large stocks. Our quality themes were consistent, with poorer quality stocks generally underperforming.
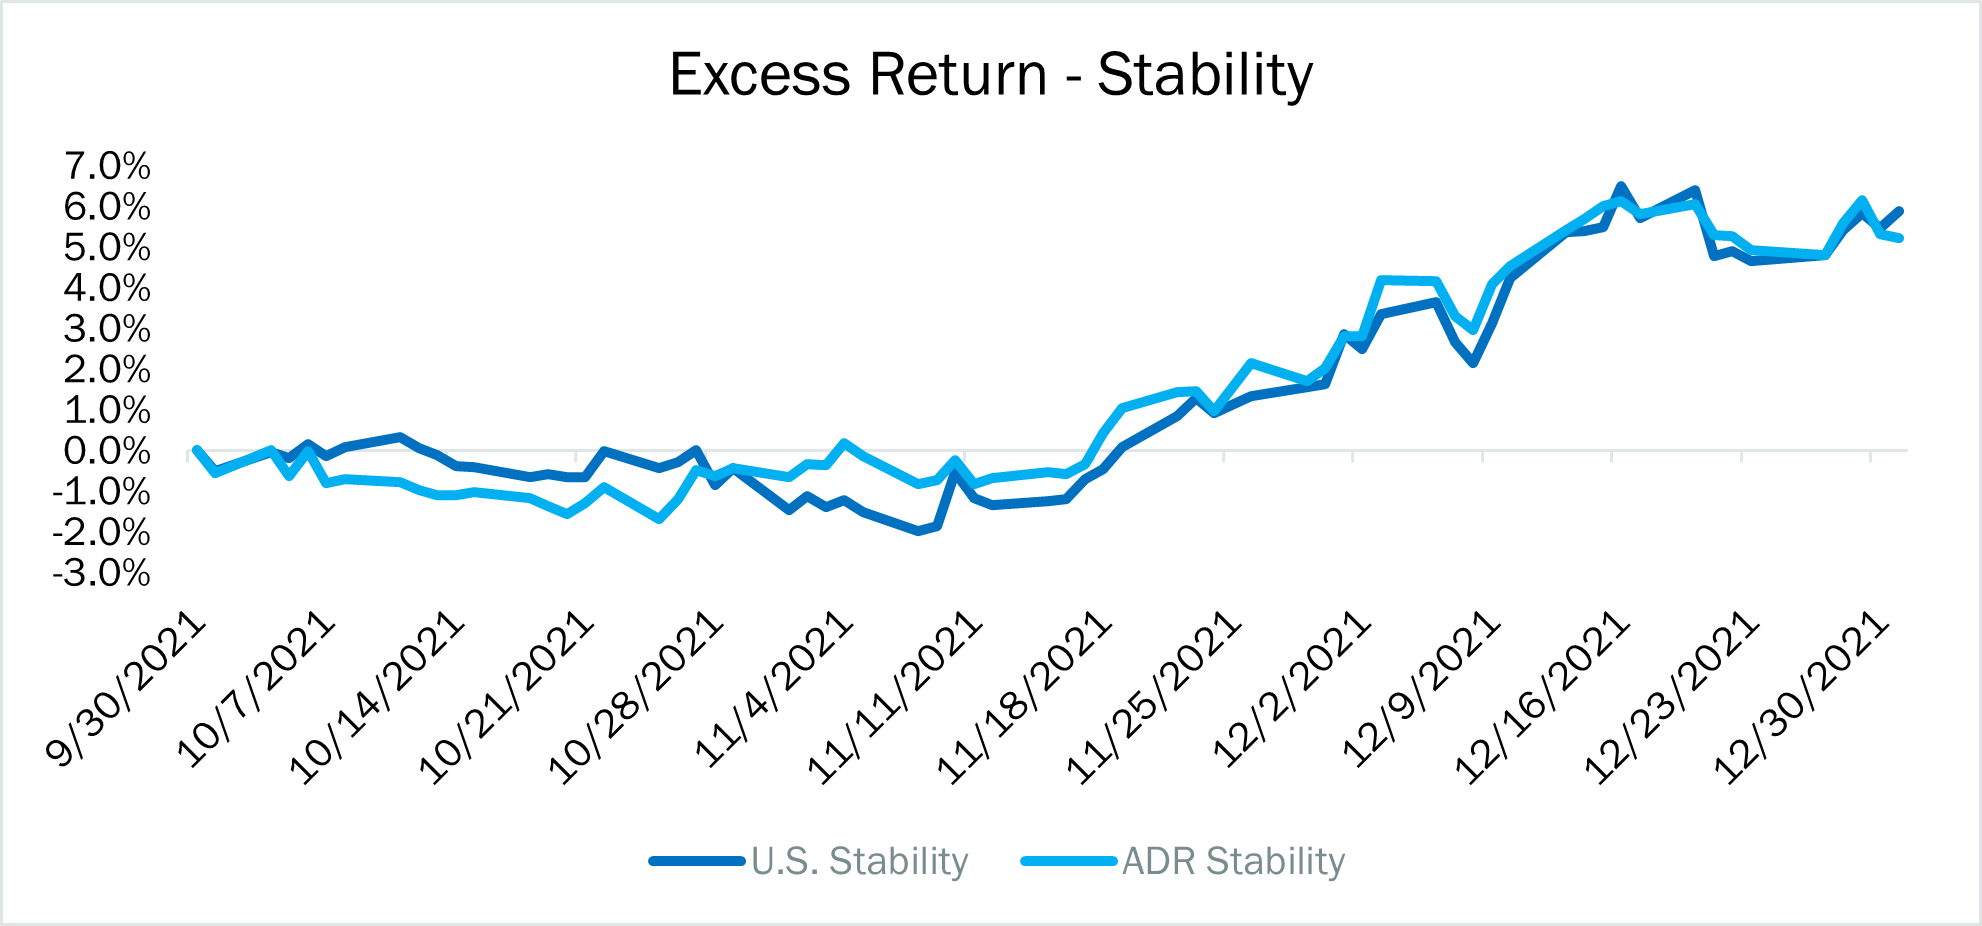
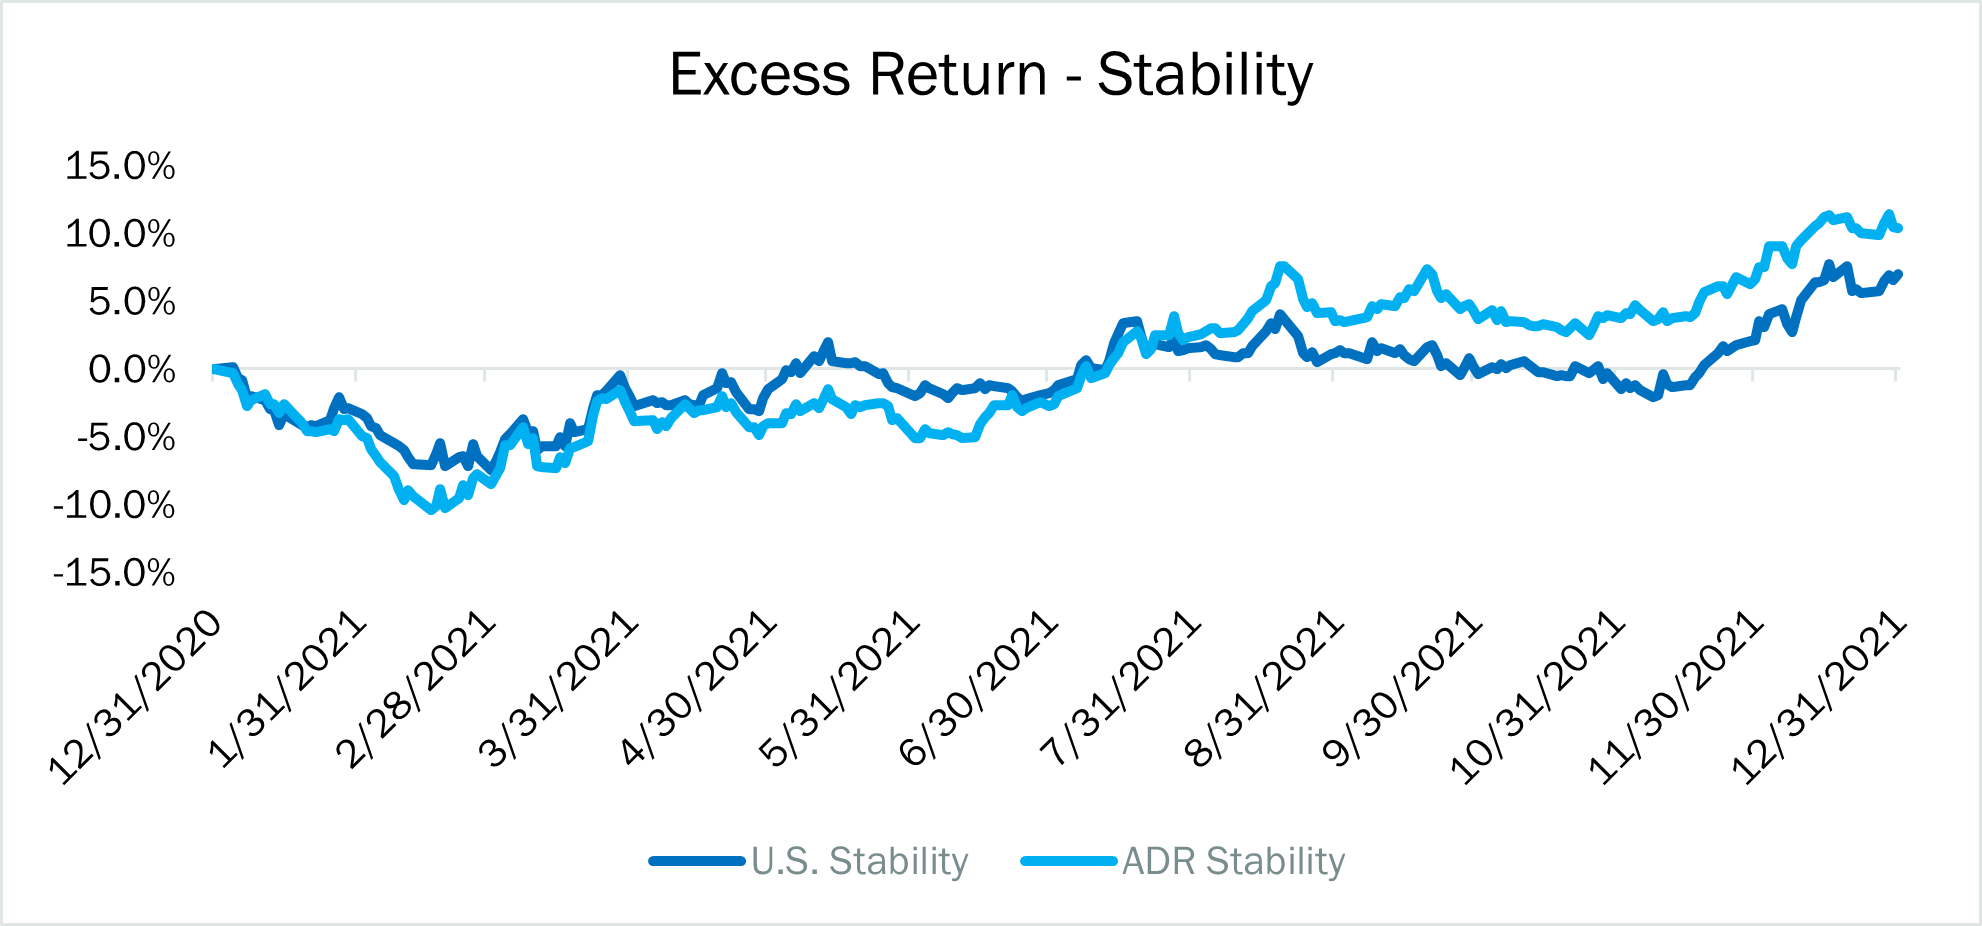
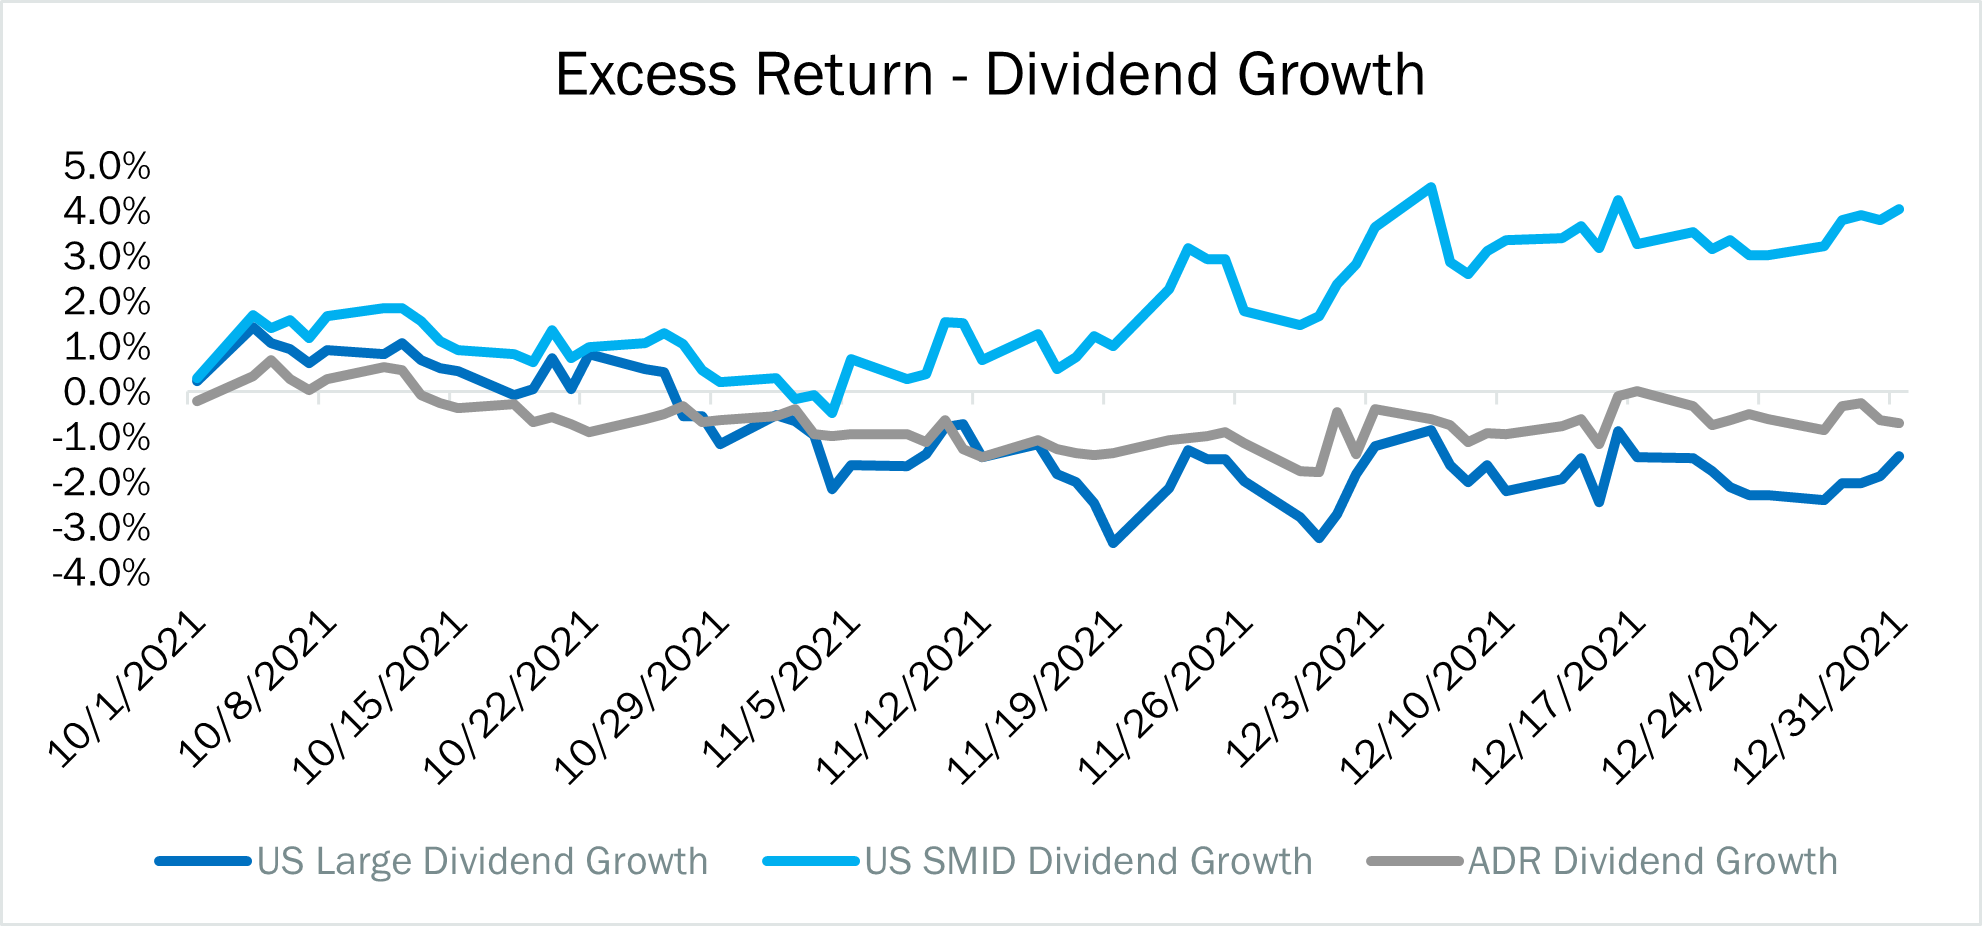
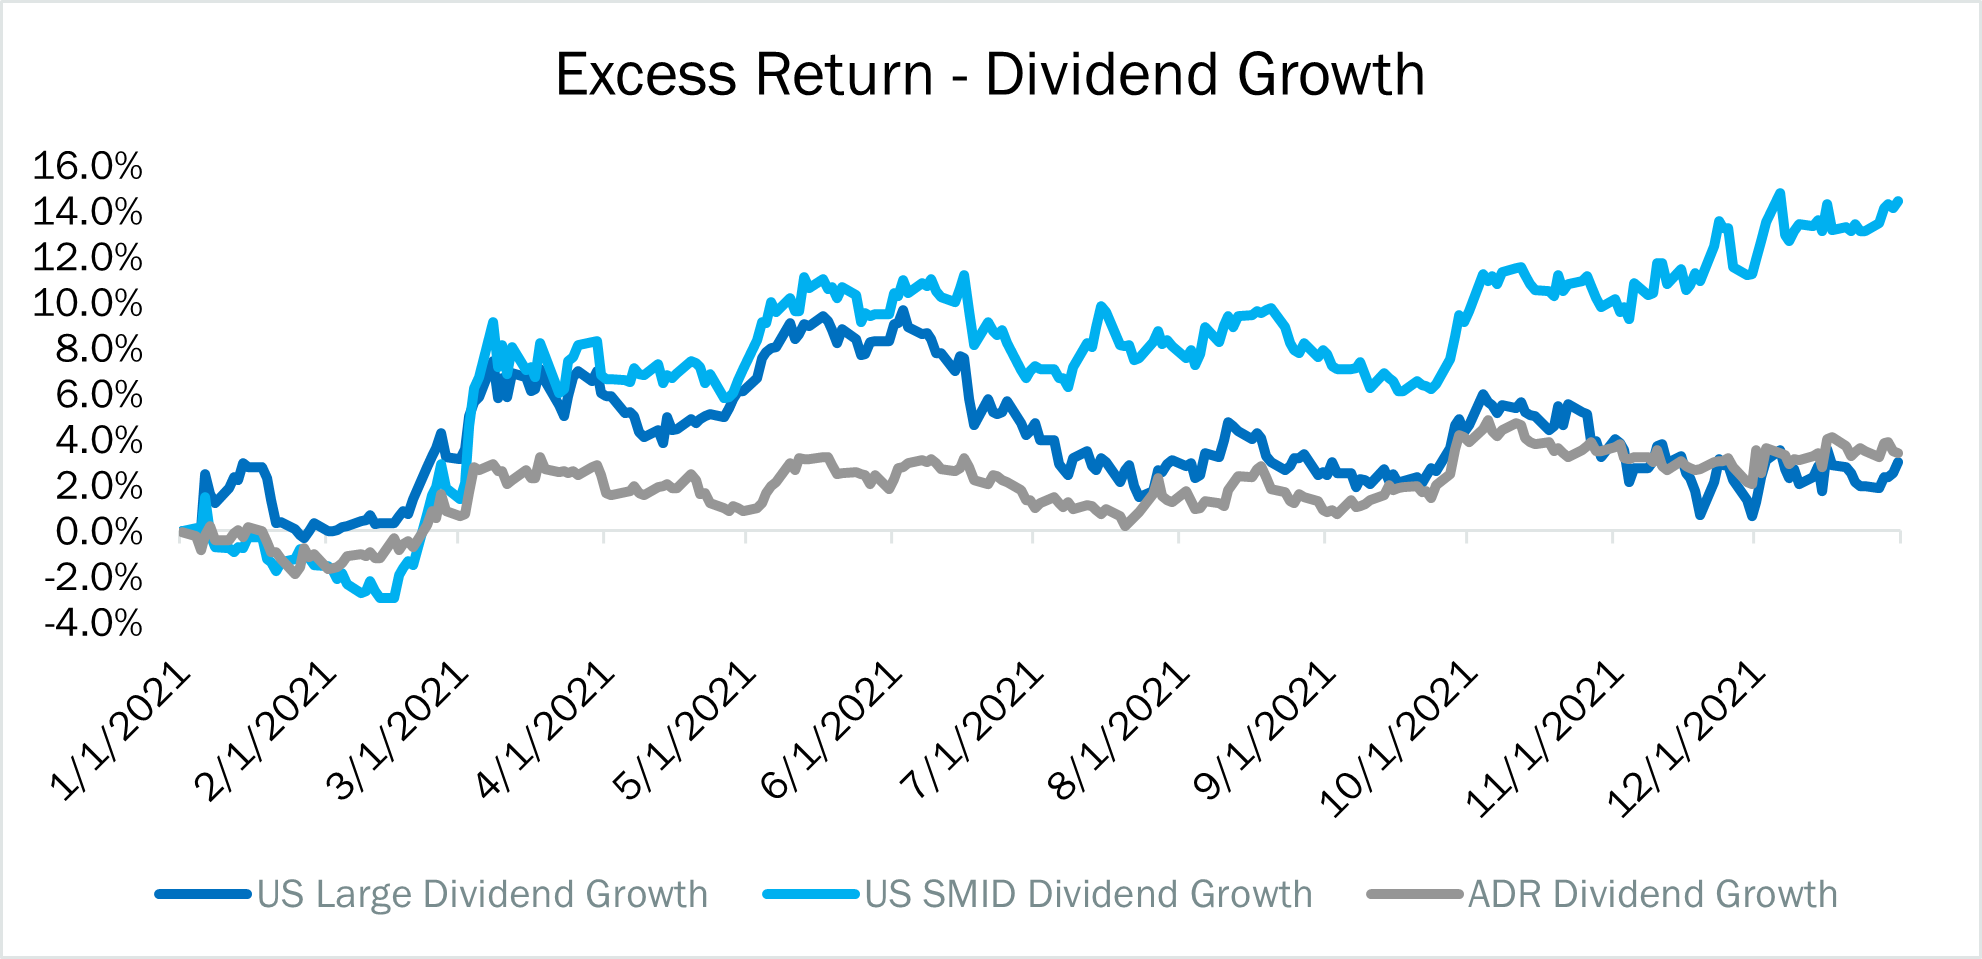
Defensive Stability and Dividend Growth
Our Stability theme identifies stocks with low volatility in sales, earnings, share issuance, and price volatility. A key feature of the theme is that it tends to offer relative downside protection in drawdowns. In “normal” environments, we would expect the strategy to keep pace with broad equities, and in strong up markets, we would expect the theme to lag. Over long periods of time, any “alpha” generated is likely via downside protection in downturns. Our Dividend Growth factor generates a similar return profile, but specifically seeks stocks with at least 5 year of consecutive annual dividend growth. Both themes generally experienced underperformance early in the year as less conservative stocks did exceptionally well. As we moved into the 4th quarter, these more conservative, lower volatility stocks tended to outperform as investor positioned themselves defensively.
Current Positioning and Outlook
The 4th quarter seems to have marked a sea change for the post-COVID market. The Fed has pivoted once again—now turning hawkish on inflation given its higher-for-longer persistence. The large stimulative fiscal response will likely also end with some form of the proposed “Build Back Better” legislation. The equity market took heed of these important developments and adjusted its reaction function accordingly.
Whether you look at high beta stocks, “innovation” stocks, “meme” stocks, or even long duration bonds, market participants are clearly requiring greater compensation for perceived risk. Who can blame them? With the collective Fed/Treasury put being relinquished, we appear to be re-pricing for a more uncertain regime.
The market has flirted with all-time highs and rapid pullbacks intermittently. The S&P 500 Volatility Index (VIX) doubled from early November into December. Quality started to matter on the factor front—a sign of investor trepidation. With outright monetary and fiscal contraction, markets seem to have already fallen back on fundamentals.
Early in 2022, we’ve seen expensive stocks pullback significantly on a relative basis. Fears of structural inflation are also impacting corners of the equity market susceptible to profit margin pressures. A corollary to this action has been quickly rising bond yields. Since the crisis, growth stocks have roughly been tracking real yields. It’s unclear whether that correlation is driven by Fed-driven manipulation (the Fed owns 25% of the real yield TIPS market and is exacerbating negative real yields) or an actual tie to cash flow discounting (the long duration aspect of expensive growth names make them more valuable as real interest rates fall).
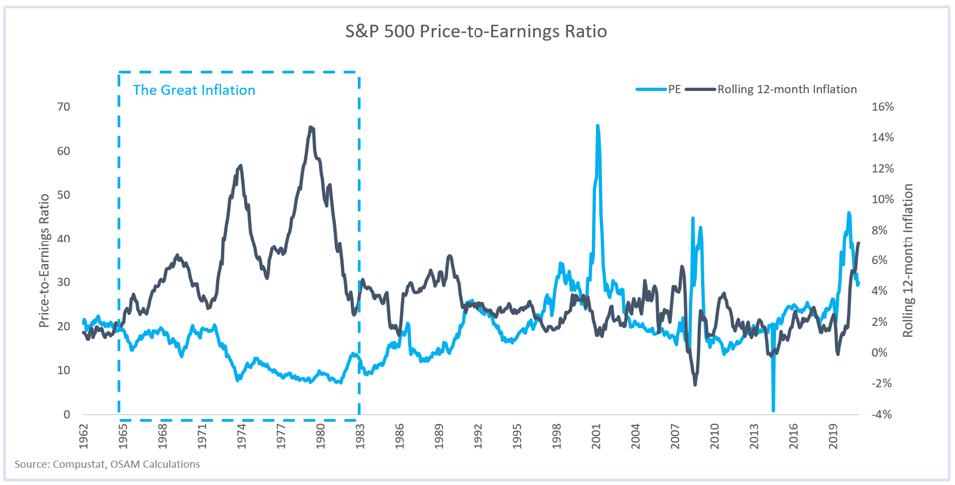
All of this is consistent with historical high inflation regimes. Notably, price-to-earnings ratios tend to contract when high inflation is present or perceived, and names with particularly high valuations are the most susceptible. The Great Inflation era is one such example.
With volatility higher recently, many investors may be relying on bond allocations to tamp down volatility. We have grown quite accustomed to the diversification benefits of stock-bond negative correlations since the tech bubble burst. It should be noted that there are historical regimes where that negative correlation has flipped positive, sometimes for an extended period of time as it did from 1965-2000.1 This will be an important trend to monitor as rate increases are implemented.
FOOTNOTES
1 Shen, Junying and Weisberger, Noah, US Stock-Bond Correlation: What are the Macroeconomic Drivers? (May 13, 2021). PGIM IAS - May 2021, Available at SSRN: https://ssrn.com/abstract=3855610
Important Legal, Canvas®, Hypothetical and/or Back-tested Disclosure Information
CANVAS® is an interactive web-based investment tool developed by O’Shaughnessy Asset Management, L.L.C. (“OSAM”) that permits an investment professional (generally a registered investment advisor or a sophisticated investor) to select a desired investment strategy for the professional’s client. At all times, the investment professional, and not OSAM, is responsible for determining the initial and ongoing suitability of any investment strategy for the investment professional’s underlying client. The professional’s client shall not rely on OSAM for any such initial or subsequent review or determination. Rather, to the contrary, at all times the professional shall remain exclusively responsible for same. See more about CANVAS below and Release and Hold Harmless at the end of this Important Disclosure Information.
Reliance on Investment Professional: OSAM has relied, and shall continue to rely, on the investment professional’s knowledge and experience to understand the inherent limitations of the performance presentation, including those pertaining to back-tested hypothetical performance. All performance presentations, including hypothetical performance, are the direct result of the investment professional’s request, independent of OSAM. Depending upon the investment professional’s direction and selection, hypothetical presentations can include both OSAM and non-OSAM Models and/or strategies. The below discussion as to the material limitations of back-tested hypotheticals apply to both OSAM and non-OSAM Models and/or strategies.
Intended Recipient: CANVAS content is intended for the investment professional only not to be shared with an underlying client unless in conjunction with a meeting between the investment professional and its client in a one-on-one setting. OSAM assumes that no hypothetical performance-related content will be provided directly to the professional’s client without the accompanying consultation and explanation of the professional. The content is intended to assist the professional in evaluating the appropriate investment strategy for the professional’s client.
OSAM Models. OSAM has devised various investment models (the “Models”) for CANVAS, the objectives of each are described herein. The investment professional is not obligated to consider or utilize any of the Models. As indicated above, at all times, the investment professional, and not OSAM, is responsible for determining the initial and ongoing suitability of any Model for the investment professional’s underlying client. Model performance reflects the reinvestment of dividends and other account earnings and are presented both net of the maximum OSAM’s investment management fee for the selected strategy and gross of an OSAM investment management fee. Please Note: As indicated at Item 5 of its written disclosure Brochure, OSAM’s CANVAS management fee ranges from 0.20% to 1.15%. The average percentage management fee for all CANVAS strategies is 0.36%. The percentage OSAM management fee shall depend upon the type of strategy and the corresponding amount of assets invested in the strategy; generally, the greater the amount of assets, the lower the percentage management fee. Please Also Note: The performance also do not reflect deduction of transaction and/or custodial fees (to the extent applicable), the incurrence of which would further decrease the performance. For example, if reviewing a strategy with a ten-year return of 10.0% each year, the effect of a 0.10% transaction/custodial fee would reduce the reflected cumulative returns from 10.0% to 9.9% on a 1-year basis, 33.1% to 32.7% on a 3-year basis, 61.1% to 60.3% on a 5-year basis and 159.4% to 156.8% on a 10-year basis respectively. Please Further Note: Transaction/custodial fees will differ depending upon the account broker-dealer/custodian utilized. While some broker-dealers/custodians do not charge transaction fees for individual equity (including ETF) transactions, others do. Some custodians charge fixed fees for custody and execution services. Choice of custodian is determined by the investment professional and his/her/its client. Higher fees will adversely impact account performance.
OSAM does not maintain actual historical performance results for the Models. In order to help assist the investment professional in determining whether a Model is appropriate for the professional’s client, OSAM has provided back-tested hypothetical (i.e., not actual) performance for the Model. OSAM, with minor deviations that it does not consider to be material*, currently uses the Models (i.e., live models vs. the reflected back-tested versions thereof) to manage actual client portfolios (see Model Deviations below). The performance reflects the current Model holdings, which are subject to ongoing change.
Material Limitations: The Performance is subject to material limitations. Please see Hypothetical/Material Limitations below. During any specific point in time or time-period, the Models, as currently comprised, performed better or worse, with more or less volatility, than corresponding recognized comparative indices, benchmarks or blends thereof.
Past performance may not be indicative of future results. Therefore, it should not be assumed that future performance of any specific investment or investment strategy (including the Models), will be profitable, equal any historical index or blended index performance level(s), or prove successful. Historical index results do not reflect the deduction of transaction and custodial charges, or the deduction of an investment management fee, the incurrence of which would have the effect of decreasing indicated historical performance results. The Russell 3000 is a market capitalization-weighted index of 3000 widely held large, mid, and small cap stocks. Russell chooses the member companies for the Russell 3000 based on market size and liquidity. The MSCI All Country World Index is a market capitalization weighted index designed to provide a broad measure of equity-market performance throughout the world. The MSCI is maintained by Morgan Stanley Capital International and is comprised of stocks from 23 developed countries and 24 emerging markets. The Barclays Capital Aggregate Bond Index is a market capitalization-weighted index, meaning the securities in the index are weighted according to the market size of each bond type. Most U.S. traded investment grade bonds are represented. Municipal bonds and Treasury Inflation-Protected Securities are excluded, due to tax treatment issues. The index includes Treasury securities, Government agency bonds, Mortgage-backed bonds, corporate bonds, and a small amount of foreign bonds traded in U.S. The historical performance results for the Russell 3000, MSCI and Barclays are provided exclusively for comparison purposes only, to provide general comparative information to help assist in determining whether a Model or other type strategy (relative to the reflected indices) is appropriate for his/her investment objective and risk tolerance. Please Also Note: (1) Performance does not reflect the impact of client-incurred taxes; (2) Neither Model or the selected strategy holdings correspond directly to any such comparative index; and (3) comparative indices may be more or less volatile than the Model or selected strategy.
Hypothetical/Material Limitations-performance reflects hypothetical back-tested results that were achieved by means of the retroactive application of a back-tested portfolio and, as such, the corresponding results have inherent limitations, including: (a) the performance results do not reflect the results of actual trading using investor assets, but were achieved by means of the retroactive application of the Model or strategy (as currently comprised), aspects of which may have been designed with the benefit of hindsight; (b) back tested performance may not reflect the impact that any material market or economic factors might have had on OSAM’s (or the investment professional’s) investment decisions for the Model or the strategy; and, correspondingly; (c) had OSAM used the Model to manage actual client assets (or had the investment professional used the selected strategy to manage actual client assets) during the corresponding time periods, actual performance results could have been materially different for various reasons including variances in the investment management fee incurred, transaction dates, rebalancing dates (increases account turnover), market fluctuation, tax considerations (including tax-loss harvesting-increases account turnover), and the date on which a client engaged OSAM’s investment management services.
MORE ABOUT CANVAS®
CANVAS® is an interactive web-based investment tool developed by O’Shaughnessy Asset Management, L.L.C. (“OSAM”) that permits an investment professional (generally a registered investment advisor or a sophisticated investor) to select a desired investment strategy (the “Strategy”) for the professional’s client. At all times, the investment professional, and not OSAM, is responsible maintaining the initial and ongoing relationship with the underlying client and rendering individualized investment advice to the client. In addition, the investment professional and not OSAM, is exclusively responsible for:
- determining the initial and ongoing suitability of the Strategy for the client;
- devising or determining the specific initial and ongoing desired Strategy;
- monitoring performance of the Strategy; and,
- modifying and/or terminating the management of the client’s account using the Strategy.
Hypothetical Limitations: To the extent that the investment professional seeks for CANVAS to provide hypothetical back-tested performance, material limitations apply-See above.
Model Deviations: As indicated above, OSAM, with minor deviations that it does not consider to be material*, currently use the Models to manage actual client portfolios (i.e., the live Models). The deviations include:
- the use of proxies if and when an ETF used in the back-test was not available*. While the back-tested and live strategies both utilize the same investment themes, back-tested proxies can deviate from live models based on limitations of historical information;
- back-tested data presented utilizes a month-end rebalance while actual live model performance reflects intra-month rebalances;
- OSAM, as a discretionary manager, can update its live models as determined necessary. These changes will then be applied retroactively to back-tested models, the resulting performance of which would be different than that of the actual historical models-see Hypothetical/Material Limitations above; and,
- Financial statement information may be restated over time, which information was not reflected in the historical back-tested models. Companies will also have mergers and acquisitions or other corporate events that can retrospectively affect the names and corporate identities of organizations in the historical back-tests. Data providers providing pricing and return information may update historical data upon discovering deficiencies or omissions.
Strategy Sampling Impact: The implementation of OSAM strategies utilize a sampling of the underlying individual Strategy positions, and, as the result thereof, the underlying securities’ weighting could unintentionally deviate +/- the Strategy allocation target OSAM calculates the CANVAS fees based on the mix of strategies that are utilized at the establishment of the account. Therefore, the sampling approach can cause deviations between the Canvas strategy allocation establishment (and its corresponding fee) and the implementation of that CANVAS strategy.
ESG Portfolios/Socially Responsible Investing Limitations. To the extent applicable to the strategy chosen by the investment professional, Socially Responsible Investing involves the incorporation of Environmental, Social and Governance considerations into the investment due diligence process (“ESG). There are potential limitations associated with allocating a portion of an investment portfolio in ESG securities (i.e., securities that have a mandate to avoid, when possible, investments in such products as alcohol, tobacco, firearms, oil drilling, gambling, etc.). The number of these securities may be limited when compared to those that do not maintain such a mandate. ESG securities could underperform broad market indices. Investors must accept these limitations, including potential for underperformance. Correspondingly, the number of ESG mutual funds and exchange-traded funds are few when compared to those that do not maintain such a mandate. As with any type of investment (including any investment and/or investment strategies recommended and/or undertaken by OSAM), there can be no assurance that investment in ESG securities or funds will be profitable or prove successful.
Tax Management Function: When requested by the investment professional, OSAM will use best efforts to work within Onboarding Budgets, Annual Tax Budgets, and Tracking Error Budgets. However, market and/or specific stock price fluctuations can occur quickly and can correspondingly adversely affect our ability to manage to specified budgets. Additionally, changes to tax budgets, cash flows in and out of an account, mandatory corporate actions, and funding with securities can also impact preciseness. The investment professional must accept this risk. In addition:
- OSAM has not, and will not, verify the accuracy of any tax-related information provided;
- In the event that any such information provided is inaccurate or incomplete, the corresponding results will be inaccurate or incomplete;
- Tracking Error Budgets are relative to the Model, not the benchmark;
- OSAM is not a CPA and this is not tax advice;
- Tax laws and rates change;
- While we seek to follow the investment professional prescribed target models, ranges, timeframes, tax budgets, and seek not to create wash sales or exceed expected tax budgets, there can be no assurance that the CANVAS tool will be able to accurately do so;; and,
- For specific personalized tax-related advice, consult with a CPA or other tax professional.
Fixed Income ETF Model-The models are constructed using passive fixed income ETFs. The models attempt to target varying levels of duration and credit exposure relative to the Barclays Aggregate Index. The expense ratios of the underlying ETF’s are born by the investor and are separate and apart from CANVAS related fees.
Miscellaneous Limitations/Issues:
- Results in the Transition Portal reflect expense ratios corresponding to the specific funds indicated/provided by the investment professional. Expense ratios are provided by an unaffiliated database. Results also reflect projected future yields corresponding to such current indicated funds. Such data may not be precise;
- The risk-free rate used in the calculation of Sortino, Sharpe, and Treynor ratios is 5%, consistently applied across time;
- OSAM did not begin to offer CANVAS until April 2019. Prior to 2007, OSAM did not manage client assets; and,
- A copy of OSAM’s written disclosure Brochure, Form CRS and Privacy Notice remains available on this CANVAS website or at www.osam.com.
Release and Hold Harmless
The professional, to the fullest extent permitted under applicable law, agrees to release, defend, indemnify and hold OSAM (including its officers, directors, members, owners, employees, agents, and affiliates) harmless from any and all adverse consequences, financial or otherwise, of any type or nature arising from or attributable to the professional’s access to, and use of, CANVAS, including, but not limited to, any claims for alleged or actual client losses or damages of any kind or nature whatsoever (including without limitation, the reimbursement of reasonable attorney’s fees, costs and expenses incurred by OSAM relating to investigating or defending any such claims and/or demands), except to the extent that actual losses are the direct result of an act or omission by OSAM that constitutes willful misfeasance, bad faith or gross negligence as adjudged by a court of final jurisdiction.
*except in the unlikely event that the performance of the proxy used in lieu of the actual ETF was materially different (positive or negative)
Lastly, please be advised, without limitation, OSAM shall not be liable for Losses resulting from or in any way arising out of (i) any action of the investor or its previous advisers or other agents, (ii) force majeure or other events beyond the control of OSAM, including without limitation any failure, default or delay in performance resulting from computer or other electronic or mechanical equipment failure, unauthorized access, strikes, failure of common carrier or utility systems, severe weather or breakdown in communications not reasonably within the control of OSAM, inaccuracy or incompleteness of any third-party data, or other causes commonly known as “acts of God,” or (iii) general market conditions. Under no circumstances shall OSAM be liable for consequential, special, incidental or indirect damages, punitive damages, or lost profits or reputational harm. Additionally, the responsibility solely rests on the “master user” of CANVAS at each independent firm, and NOT OSAM, to close out any associated users who may terminate at any time.
O’Shaughnessy Asset Management, LLC (OSAM) is a wholly owned subsidiary of Franklin Resources Inc./(Franklin Templeton).