Helping Financial Advisors Solve ESG Investing Challenges
By OSAM Research TeamMarch 2021
Demand for sustainable investing and ESG related strategies are at all-time highs. Last year, U.S. sustainable fund flows totaled $51.2B, more than double the 2019 figure and ten times larger than 2018.1 Yet, despite the ballooning product market, advisors still face numerous challenges in ESG investing:
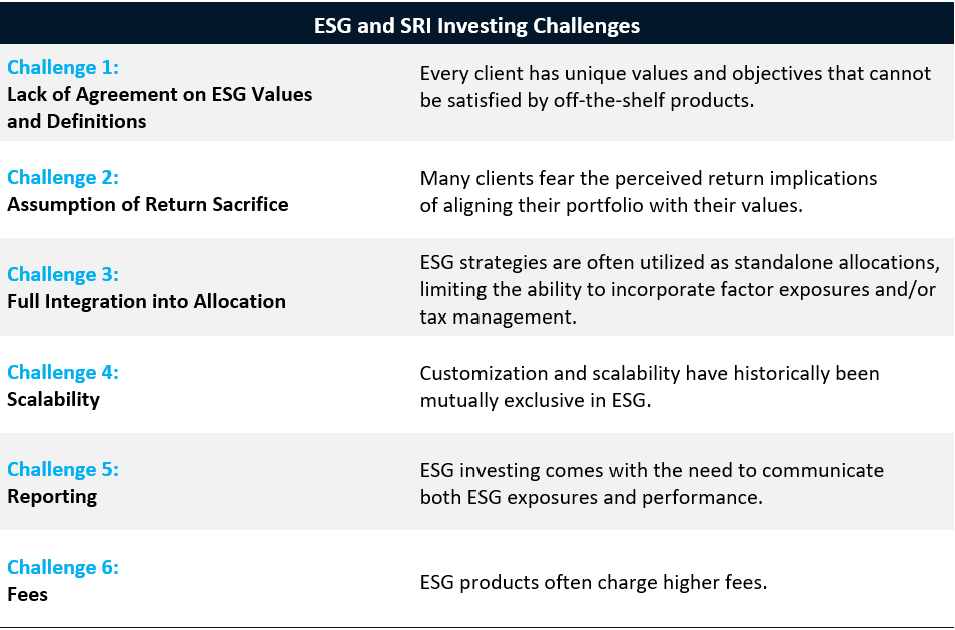
The following sections walk through our process and address how we solve these six challenges.
CHALLENGE 1: LACK OF AGREEMENT ON ESG VALUES AND DEFINITIONS
ESG investing is a uniquely personal process. While some investors exclusively care about eliminating fossil fuels, others may seek portfolios with diversity, equality, and inclusion (DEI) values. Even for investors that share the same values of climate change, they may differ in their implementation preferences. One might choose divestment as their primary approach, while the other elects to overweight companies displaying positive behavior. This diverse and personal aspect of ESG investing can produce gaps between client values and available off-the-shelf ESG products (ETFs and Funds).
ETFs must adopt a one-size-fits-all approach, producing strategies that may be too broad for the individual investor, not effectively tilt, or exclude too much or too little of a theme – all downsides to a pooled vehicle. Additionally, some ETFs have been criticized for voting shares counter to the values of their investors. Our experience has taught us that customization offers a better solution for serving investors that wish to truly align their values and investments.
With respect to ESG definitions, many products do a great job of marketing their benefits but fall short on transparency. Without seeing or understanding exactly how something is built, it is hard for an advisor to know if they are successfully fulfilling their client’s mandate. Take for example, this environmental-focused Index:
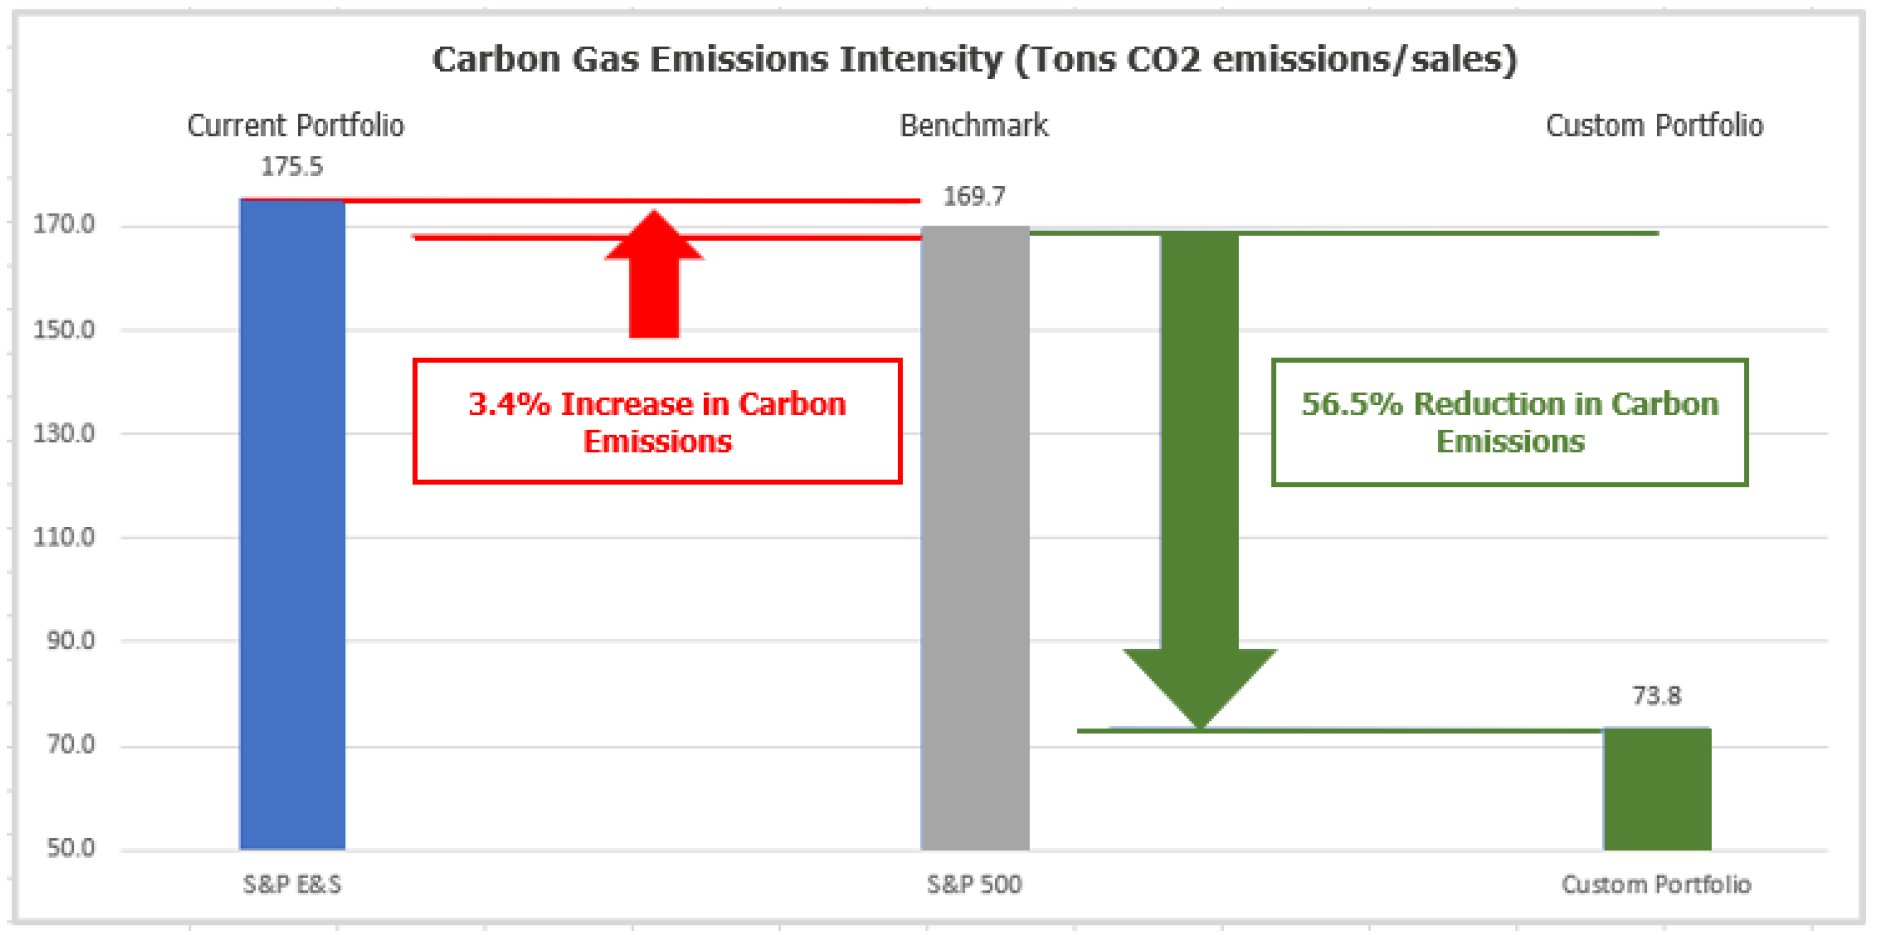
This is a classic case of an advisor thinking they were effectively executing an ESG mandate when they were not. In this example, a foundation wanted to minimize their carbon emissions, so their advisor invested in an environmental and social index. While the fossil fuel exclusions in this index seemed reasonable at first glance, upon further inspection it became evident that the carbon emissions were actually higher than the non-sustainable benchmark and significantly higher than the recommended Canvas portfolio. In this case, the index was overweight several high carbon emitters not included on the exclusionary fossil fuel list.
When building a portfolio, advisors and their clients should receive exactly what they want and know precisely what the intended exposures look like. In Canvas, advisors can start with a previously developed ESG model, or build a unique portfolio using our suite of 50+ ESG and SRI themes. In cases where we may not have existing coverage, we can work with advisors and their clients to build a new theme or dataset from scratch. When constructing portfolios, advisors can choose to screen out bad companies and tilt toward/away from good/bad companies. ESG investing is not solely divestment and the image below demonstrates how investors can not only select themes, but also weight themes according to their importance.

In addition to tilting and exclusionary capabilities, investors can choose to take an active ownership approach. OSAM has socially responsible proxy voting that investors can opt to implement.
CHALLENGE 2: ASSUMPTION OF RETURN SACRIFICE
Our approach to delivering the available ESG and SRI screens is to maximize optionality for customization and flexibility. Many of these screens or factors do not have the data history to empirically test and form an opinion on long-term positive or negative return. As a solution, we can forecast the effect each decision has on the range of future returns. In doing so, we can balance the clients desire to integrate values into their portfolio with the expected tracking error these choices add to future returns. We have found that just as investors have a range of preference in ESG factors, they also have different sensitivities to tracking error. Canvas makes it easy to accommodate these differences in preferences.
Regardless of the selected screens or ESG themes an investor wishes to express; we build selections on top of the advisor’s underlying investment model. Minimizing the expected return deviation of the ESG portfolio versus the baseline non-ESG portfolio is an integral part of our process. Said differently, we optimize for individual values while working to maintain the efficacy and expected return of the investment model.2 We feel confident that this implementation method enables investors to “do good for society” and “do good financially”.
CHALLENGE 3: FULL INTEGRATION INTO ALLOCATION
Every Canvas portfolio is constructed within a single SMA that is inclusive of all ESG, tax optimization, and factor decisions needed to build a cohesive portfolio. We have found that most ESG investors are not just concerned with values-based exposures. Many have unique tax situations and/or are interested in factor exposures as well. The existing landscape of ETFs and mutual funds makes it difficult to effectively account for ESG, tax management, and factor exposure in one account.
This is evident by the numerous prospect portfolios we see holding a core equity index, an ETF with their preferred factor tilts, and an environmentally focused ETF. Combinations like these are problematic as none of the separate funds communicate with one another. This produces overlapping positions that create unintended risk as the broad index has no factor or ESG goals, the factor position has no ESG goals, and the ESG position has no factor goals. Additionally, due to the vehicle stricture, tax management across the three funds is significantly limited.
The Canvas SMA vehicle enables advisors to build portfolios with custom allocations that include ESG values, factor exposures, and harness sophisticated tax management within a single account. When dealing with comingled funds, these four elements often conflict with one another. Building a balanced portfolio in one account enables more investors to emphasize socially responsible goals – no matter how big or small.
CHALLENGE 4: SCALABILITY
We developed Canvas to enable financial advisors to build custom portfolios with scale that also adhere to their legacy investment models. To us, scalability for advisors means maintaining consistency across their book and creating portfolios efficiently. This is primarily achieved in one of two ways: 1) advisors create ESG portfolios from a core investment model or 2) advisors start with a custom built ESG model and tailor the allocation to individual investment targets.
When creating an ESG portfolio from a core investment model, our process starts with the advisor’s model (the strategic allocation of public equities) and then blends ESG decisions into the underlying model while aiming to minimize risk and expected return deviation. This means all client accounts can start from the same base (or fundamentals) but be customized for individual values.
Separately, for advisors building their businesses around specific values-based themes like women empowerment, religious values, and social justice; we have worked with them to build ESG investment models from scratch. In these instances, the advisor has wanted a flagship ESG model that they can easily apply to a variety of asset allocations to fit the specific needs of investors. This approach creates a starting ESG foundation that advisors can further tinker for individual investment, exposure, and values goals.
Additionally, maintenance and performance of Canvas portfolios are managed within a web-based platform which places emphasis on simplicity, transparency, and convenience for advisors.
CHALLENGE 5: REPORTING
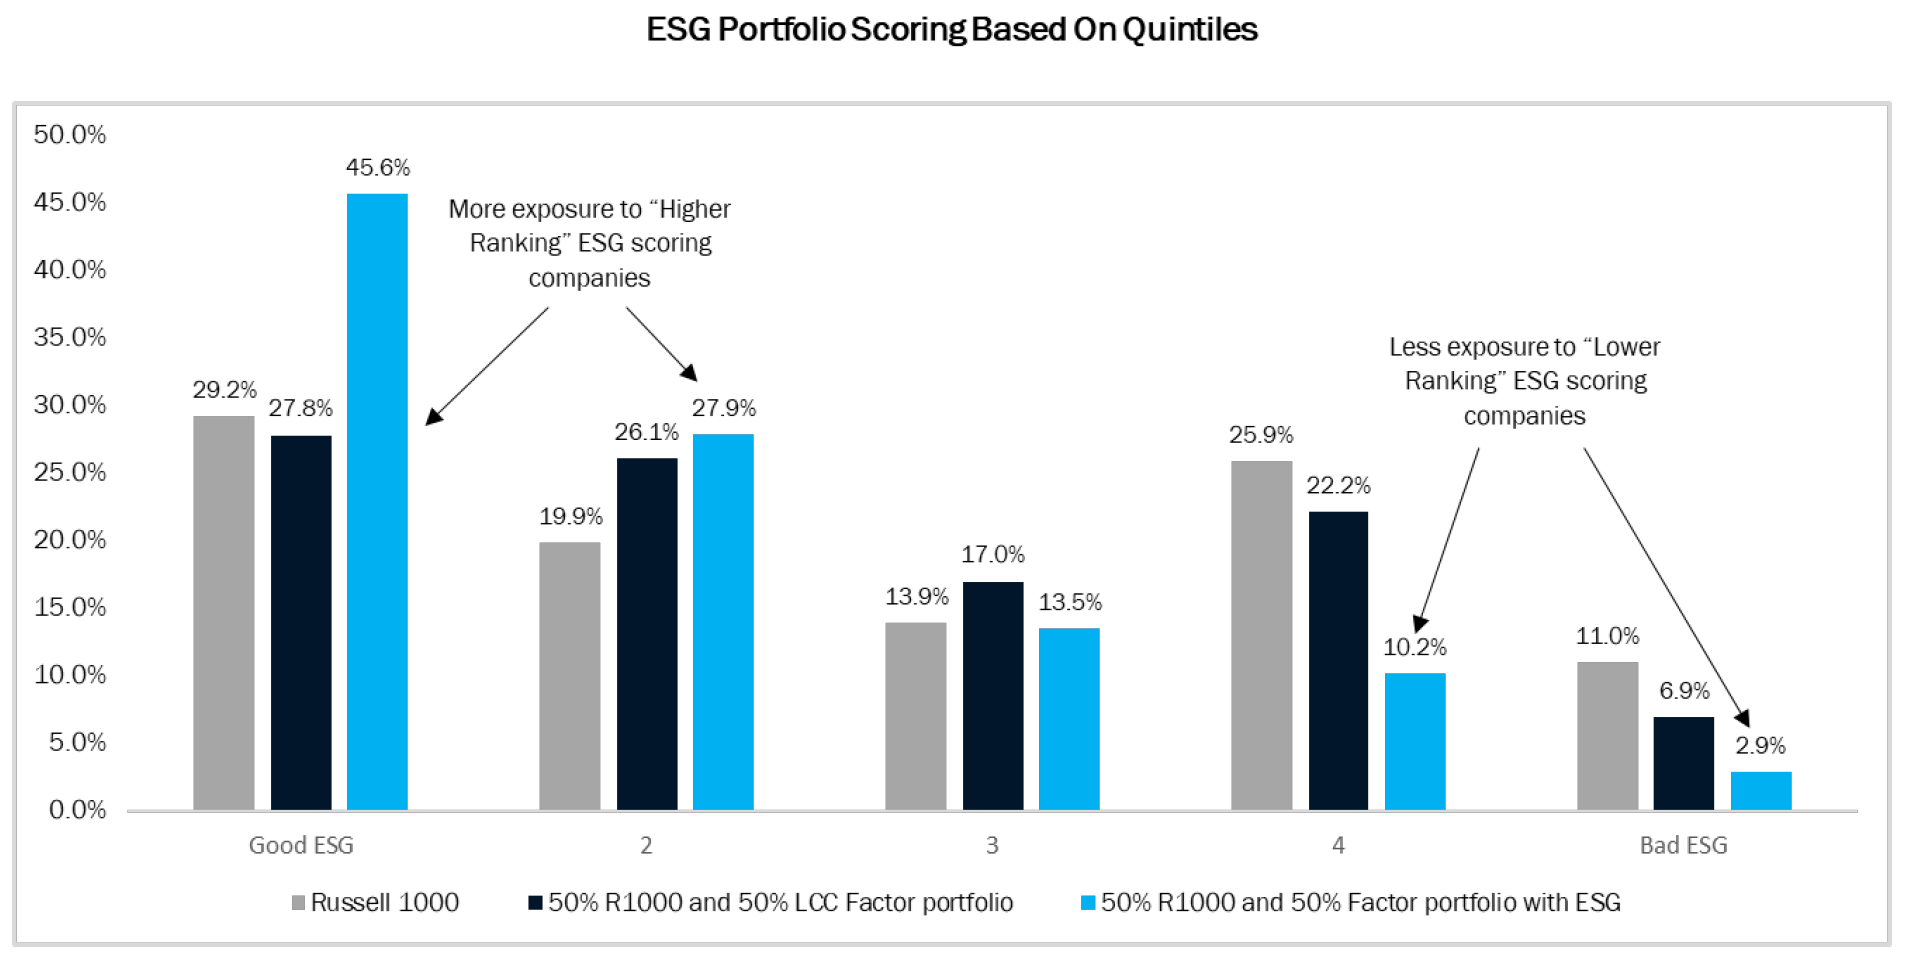
We have found that advisors need to communicate ESG investing impacts in a meaningful and scalable way. Below are two examples of how we report exposures on portfolios. The first chart is a standard quintile chart where advisors can highlight how values-based decisions are increasing the weight to stocks strongly aligned with their values while reducing the weight to lower scoring stocks. Every portfolio will look different, but thematically this reallocation from lower scoring companies to higher scoring companies will be consistent and in line with the selected importance levels of their client.
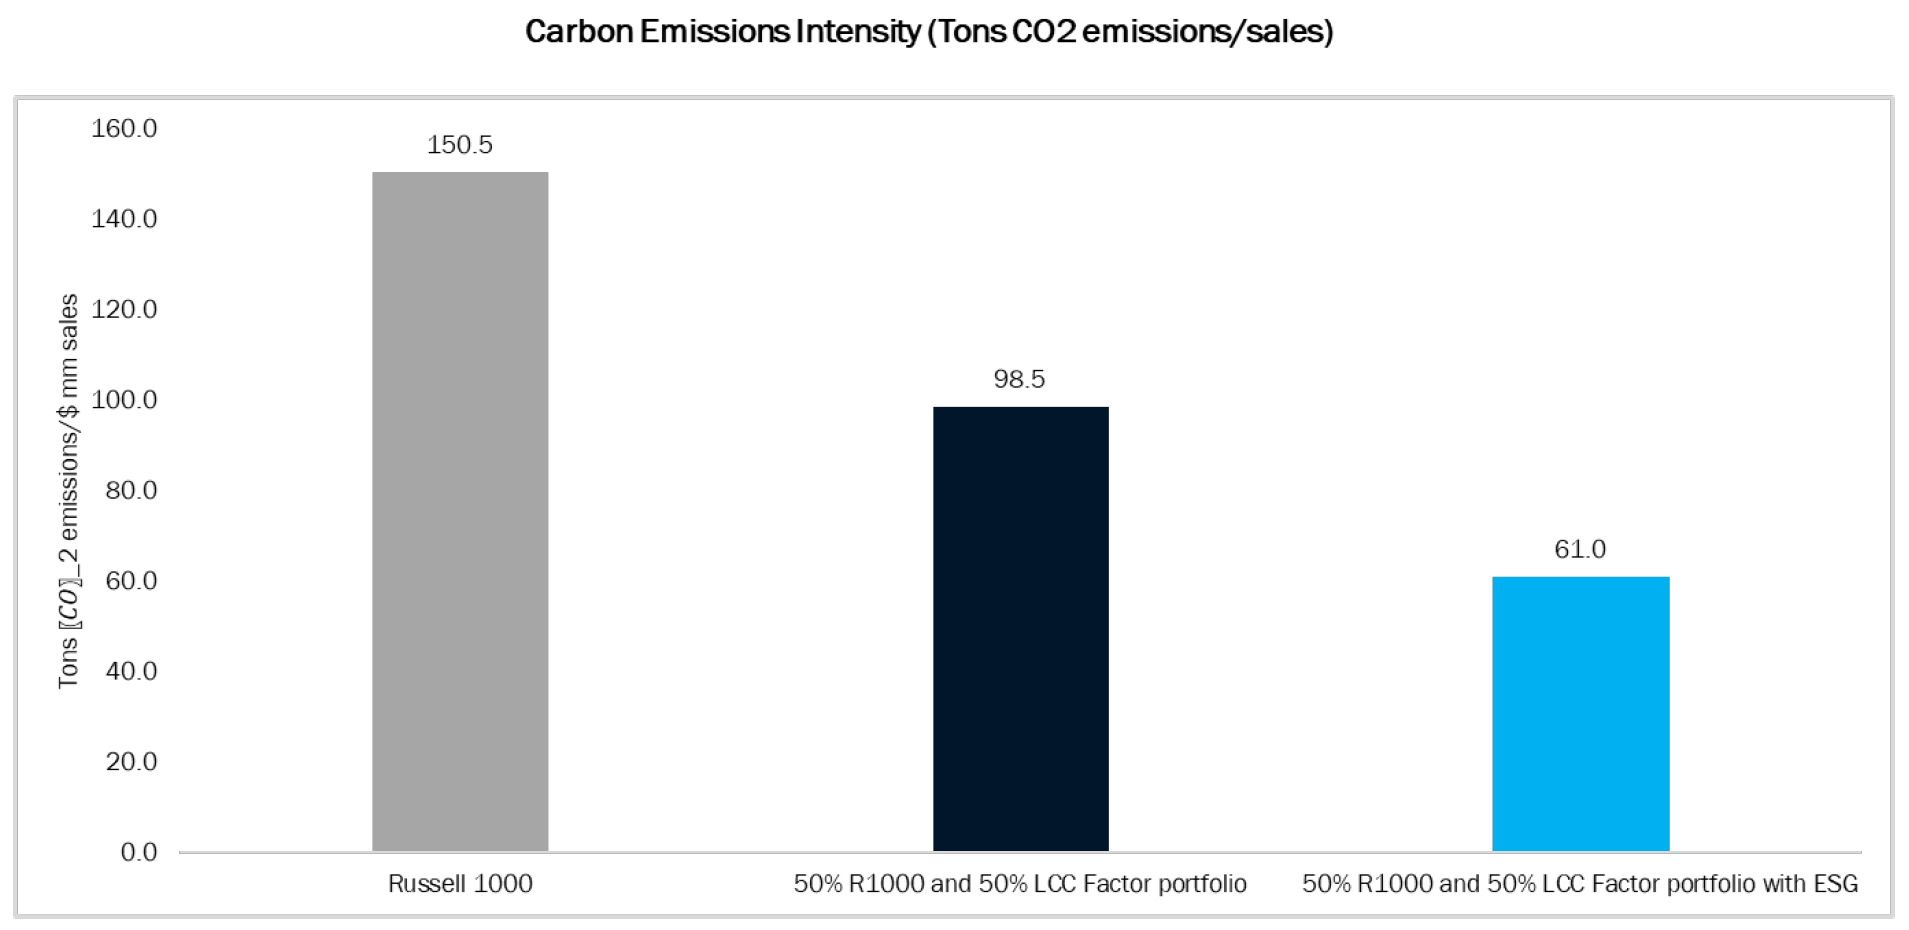
When relevant to the client’s selections, we can show various analyses that emphasize the “improvement” of a portfolio based on quantifiable “values metrics” such as carbon emissions. This allows advisors to easily highlight key metrics that resonate with clients.
CHALLENGE 6: FEES
For some fund managers, ESG offerings are an opportunity to charge higher fees. The average asset-weighted ESG ETF fee is 0.57% while the average asset-weighted passive ETF fee is only 0.13%.3, 4 We feel strongly that unique values and ESG goals should not cost investors exorbitant fees. Therefore, our ESG clients are not charged more than non-ESG clients and are not subject to separate account minimums.
Platform versus product
These six challenges are general issues we commonly see for most advisors. But every advisor is different, and we work with them to solve very granular problems: designing a new ESG template, adding a new factor or dataset, building out a specific reporting visual, etc. As a software platform, new capabilities or datasets are accessible to everybody once they are developed. This instant, widespread access is a critical differentiator between a platform and a product. Each additional piece added to the Canvas platform has a compounding advantage that creates a better experience for existing and future customers.
Conclusion
Trends suggest ESG investing will continue to grow in importance and we believe meeting this demand is better achieved through customization. Using Canvas, financial advisors can differentiate themselves with their ability to offer more choices and specificity to ESG investors; build portfolios within the confines of their underlying investment models; and execute, implement, and report on accounts in an operationally efficient way.
If you would like to learn more about the Canvas ESG offering or have a specific mandate in mind, please reach out to us at esg@osam.com.
Footnotes:
1 https://www.morningstar.com/articles/1019195/a-broken-record-flows-for-us-sustainable-funds-again-reach-new-heights
2 We use forecasted tracking error to measure how the ESG choices will affect performance (positive or negative).
3 https://www.etftrends.com/esg-channel/increased-competition-in-esg-category-has-dragged-down-fund-costs/
4 https://www.barrons.com/articles/mutual-fund-fees-etf-passive-investing-financial-advice-morningstar-51591719173
GENERAL LEGAL DISCLOSURES & HYPOTHETICAL AND/OR BACKTESTED RESULTS DISCLAIMER
The material contained herein is intended as a general market commentary. Opinions expressed herein are solely those of O’Shaughnessy Asset Management, LLC and may differ from those of your broker or investment firm.
Please remember that past performance may not be indicative of future results. Different types of investments involve varying degrees of risk, and there can be no assurance that the future performance of any specific investment, investment strategy, or product (including the investments and/or investment strategies recommended or undertaken by O’Shaughnessy Asset Management, LLC), or any non-investment related content, made reference to directly or indirectly in this piece will be profitable, equal any corresponding indicated historical performance level(s), be suitable for your portfolio or individual situation, or prove successful. Due to various factors, including changing market conditions and/or applicable laws, the content may no longer be reflective of current opinions or positions. Moreover, you should not assume that any discussion or information contained in this piece serves as the receipt of, or as a substitute for, personalized investment advice from O’Shaughnessy Asset Management, LLC. Any individual account performance information reflects the reinvestment of dividends (to the extent applicable), and is net of applicable transaction fees, O’Shaughnessy Asset Management, LLC’s investment management fee (if debited directly from the account), and any other related account expenses. Account information has been compiled solely by O’Shaughnessy Asset Management, LLC, has not been independently verified, and does not reflect the impact of taxes on non-qualified accounts. In preparing this report, O’Shaughnessy Asset Management, LLC has relied upon information provided by the account custodian. Please defer to formal tax documents received from the account custodian for cost basis and tax reporting purposes. Please remember to contact O’Shaughnessy Asset Management, LLC, in writing, if there are any changes in your personal/financial situation or investment objectives for the purpose of reviewing/evaluating/revising our previous recommendations and/or services, or if you want to impose, add, or modify any reasonable restrictions to our investment advisory services. Please Note: Unless you advise, in writing, to the contrary, we will assume that there are no restrictions on our services, other than to manage the account in accordance with your designated investment objective. Please Also Note: Please compare this statement with account statements received from the account custodian. The account custodian does not verify the accuracy of the advisory fee calculation. Please advise us if you have not been receiving monthly statements from the account custodian. Historical performance results for investment indices and/or categories have been provided for general comparison purposes only, and generally do not reflect the deduction of transaction and/or custodial charges, the deduction of an investment management fee, nor the impact of taxes, the incurrence of which would have the effect of decreasing historical performance results. It should not be assumed that your account holdings correspond directly to any comparative indices. To the extent that a reader has any questions regarding the applicability of any specific issue discussed above to his/her individual situation, he/she is encouraged to consult with the professional advisor of his/her choosing. O’Shaughnessy Asset Management, LLC is neither a law firm nor a certified public accounting firm and no portion of the newsletter content should be construed as legal or accounting advice. A copy of the O’Shaughnessy Asset Management, LLC’s current written disclosure statement discussing our advisory services and fees is available upon request
The risk-free rate used in the calculation of Sortino, Sharpe, and Treynor ratios is 5%, consistently applied across time
The universe of All Stocks consists of all securities in the Chicago Research in Security Prices (CRSP) dataset or S&P Compustat Database (or other, as noted) with inflation-adjusted market capitalization greater than $200 million as of most recent year-end. The universe of Large Stocks consists of all securities in the Chicago Research in Security Prices (CRSP) dataset or S&P Compustat Database (or other, as noted) with inflation-adjusted market capitalization greater than the universe average as of most recent year-end. The stocks are equally weighted and generally rebalanced annually
Hypothetical performance results shown on the preceding pages are backtested and do not represent the performance of any account managed by OSAM, but were achieved by means of the retroactive application of each of the previously referenced models, certain aspects of which may have been designed with the benefit of hindsight
The hypothetical backtested performance does not represent the results of actual trading using client assets nor decision-making during the period and does not and is not intended to indicate the past performance or future performance of any account or investment strategy managed by OSAM. If actual accounts had been managed throughout the period, ongoing research might have resulted in changes to the strategy which might have altered returns. The performance of any account or investment strategy managed by OSAM will differ from the hypothetical backtested performance results for each factor shown herein for a number of reasons, including without limitation the following:
- Although OSAM may consider from time to time one or more of the factors noted herein in managing any account, it may not consider all or any of such factors. OSAM may (and will) from time to time consider factors in addition to those noted herein in managing any account.
- OSAM may rebalance an account more frequently or less frequently than annually and at times other than presented herein.
- OSAM may from time to time manage an account by using non-quantitative, subjective investment management methodologies in conjunction with the application of factors.
- The hypothetical backtested performance results assume full investment, whereas an account managed by OSAM may have a positive cash position upon rebalance. Had the hypothetical backtested performance results included a positive cash position, the results would have been different and generally would have been lower.
- The hypothetical backtested performance results for each factor do not reflect any transaction costs of buying and selling securities, investment management fees (including without limitation management fees and performance fees), custody and other costs, or taxes – all of which would be incurred by an investor in any account managed by OSAM. If such costs and fees were reflected, the hypothetical backtested performance results would be lower.
- The hypothetical performance does not reflect the reinvestment of dividends and distributions therefrom, interest, capital gains and withholding taxes.
- Accounts managed by OSAM are subject to additions and redemptions of assets under management, which may positively or negatively affect performance depending generally upon the timing of such events in relation to the market’s direction.
- Simulated returns may be dependent on the market and economic conditions that existed during the period. Future market or economic conditions can adversely affect the returns.