History, Platforms & Mass Customization
By Jamie CatherwoodFebruary 2021
TECHNOLOGY ENABLED CUSTOMIZATION
As covered in the first installment of this three-part series on “The Road to Custom Indexing”, demand for customization and products tailored to individuals often arise when a good or service becomes abundant and commoditized. While the field of Finance and Investment is most apt for our discussion, this maxim generally holds true across all industries.
A proliferation of personalized products and services is usually facilitated by a simultaneous boom in new technologies that enable greater efficiency and customization at scale. In this post we will look at an example of customization put to work in an industry outside of finance: automobiles.
PLATFORM-BASED PRODUCTS & MASS CUSTOMIZATION: HENRY FORD
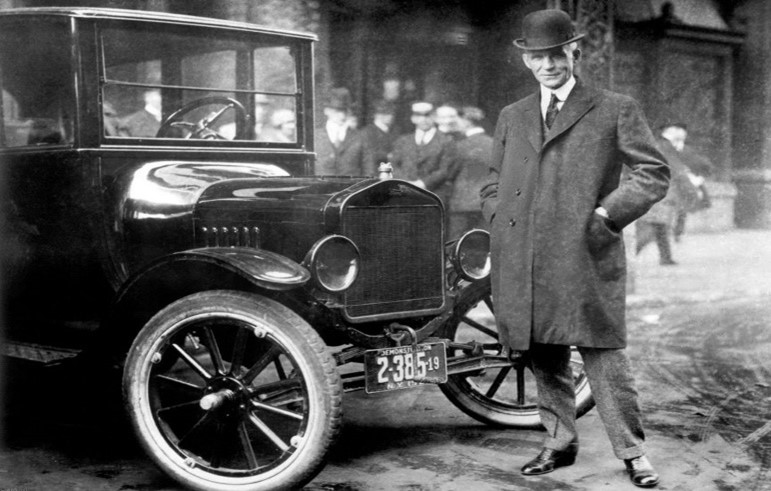
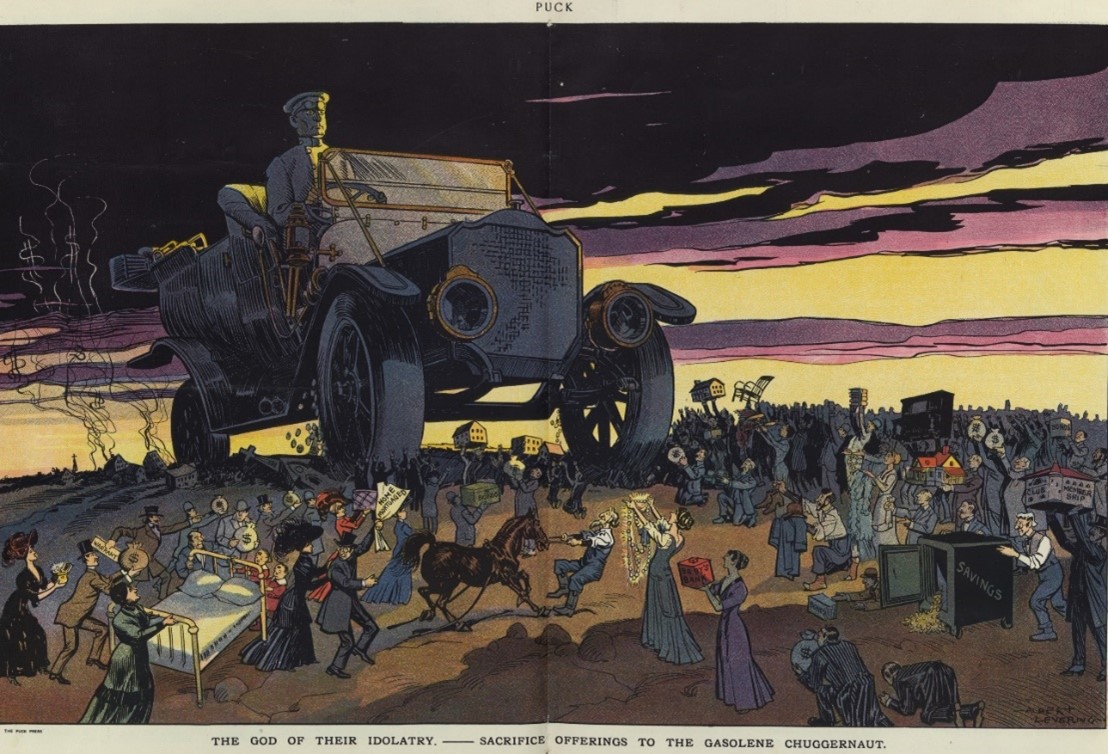
"Any customer can have a car painted any color that he wants, so long as it is black." - Henry Ford (circa 1908)
In addition to founding the Ford Motor Company, Henry Ford is remembered for an innovation that revolutionized manufacturing: the moving assembly line. Most people, however, are unaware that Ford also championed the concept of “Mass Customization” – defined as:
“A strategy for fulfilling individual customer’s desires with maintaining mass production efficiency. Duray et al.’s claim that mass customization must include the purchaser in the design procedure.”1
The Model T Common Platform
There is no questioning Ford’s role in revolutionizing mass production through moving assembly lines and the adoption of Frederic Taylor’s Scientific Management principles.
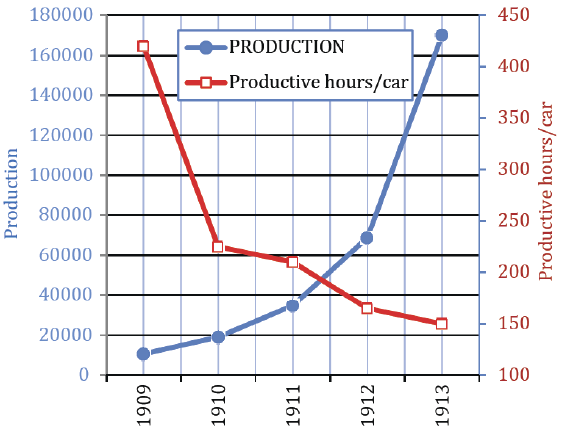
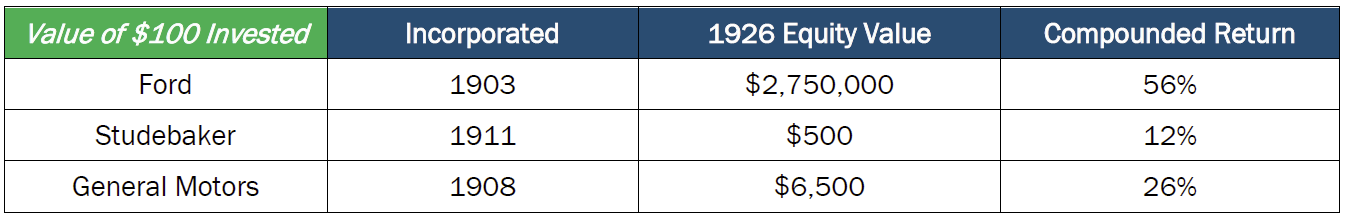
This efficiency helped drive down assembly times, and increased profit margins. This was very rewarding for investors:
Some argue that Ford’s Model T also exemplified the core traits of a “platform-based product.”
“Each Model T model was built on the same platform, with a deep level of customization: the body was specific to each model… principles for mass customization by developing a core platform with a high level of production while outsourcing tailored products to specialized companies.”2
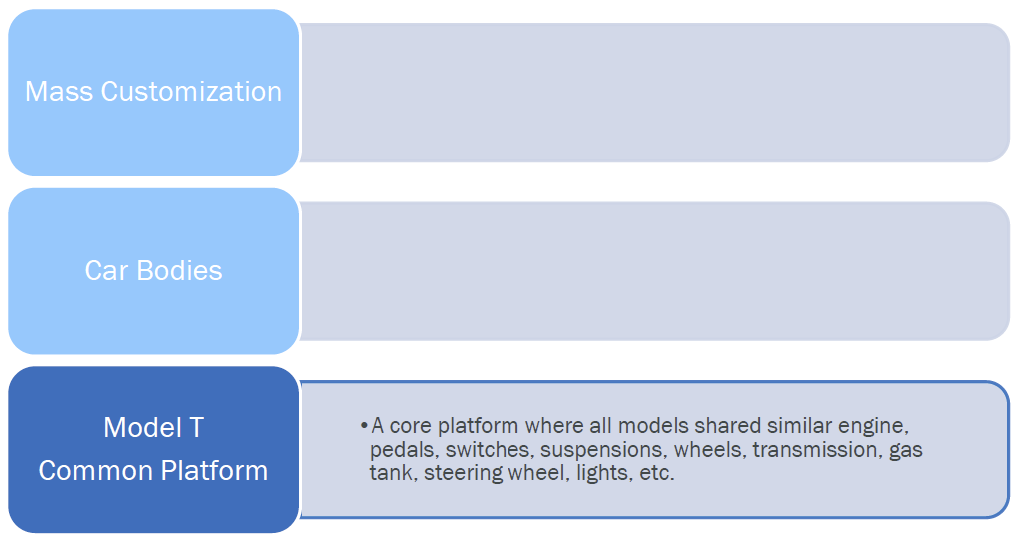
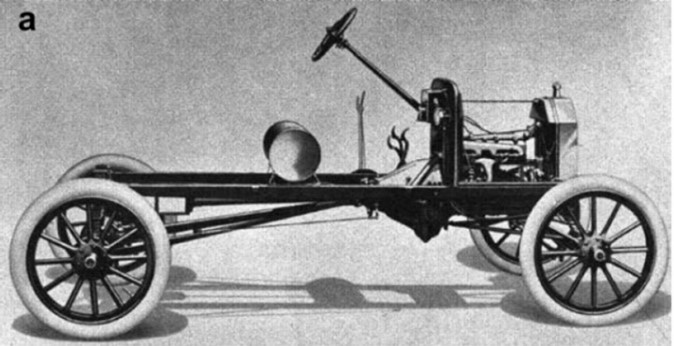
In short, all the Model T’s shared a common core platform: engine, pedals, switches, suspensions, wheels, transmission, gas tank, steering wheel, lights, etc. (shown below).3
Car "Bodies" Built on the Common Platform
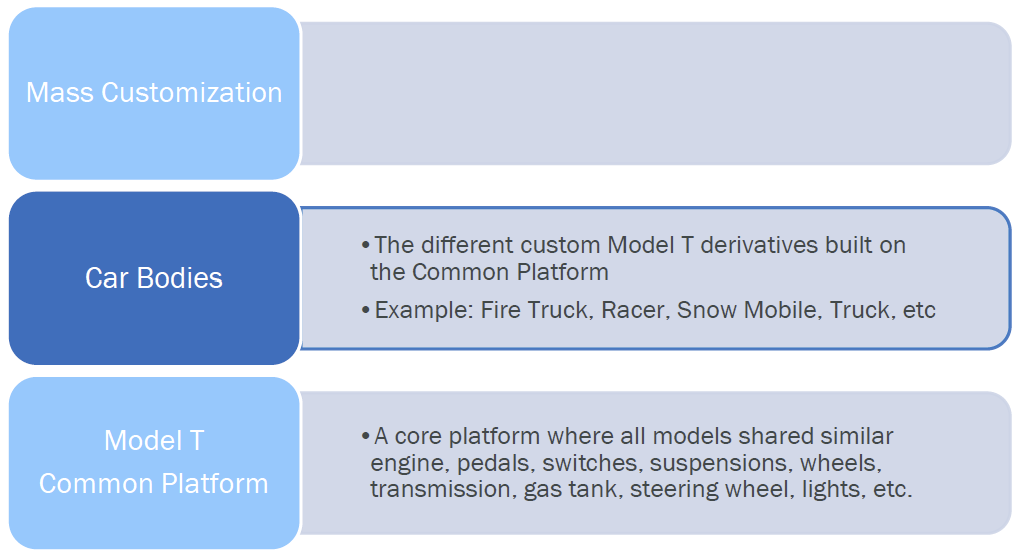
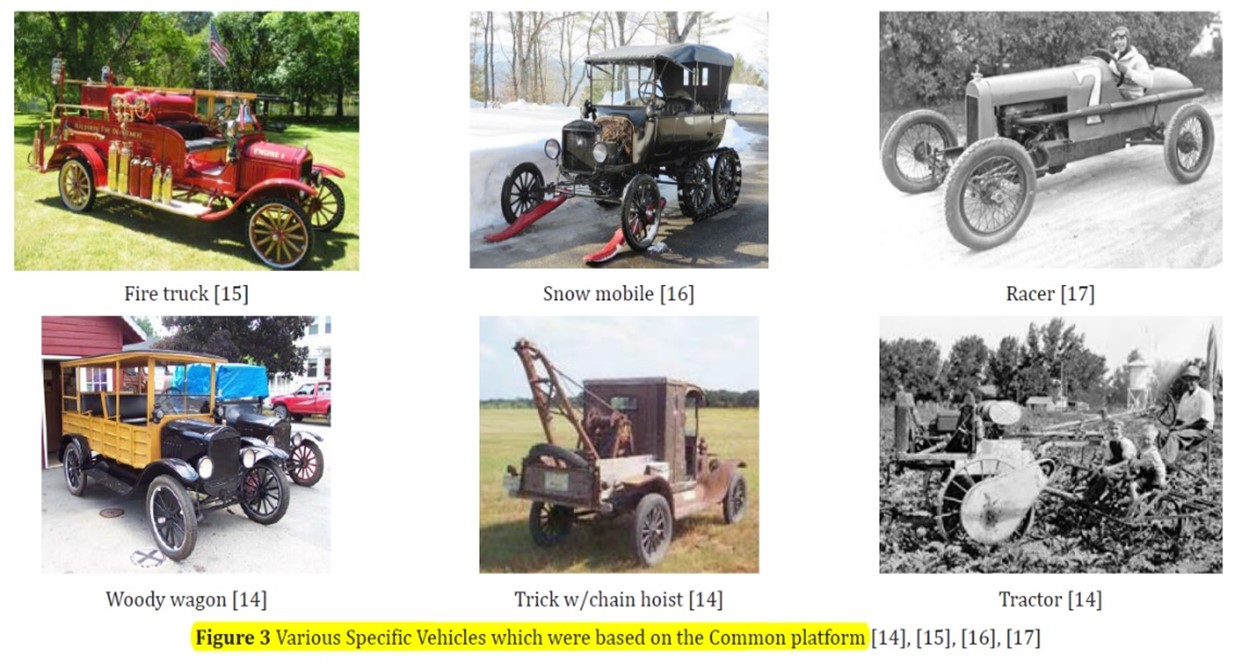
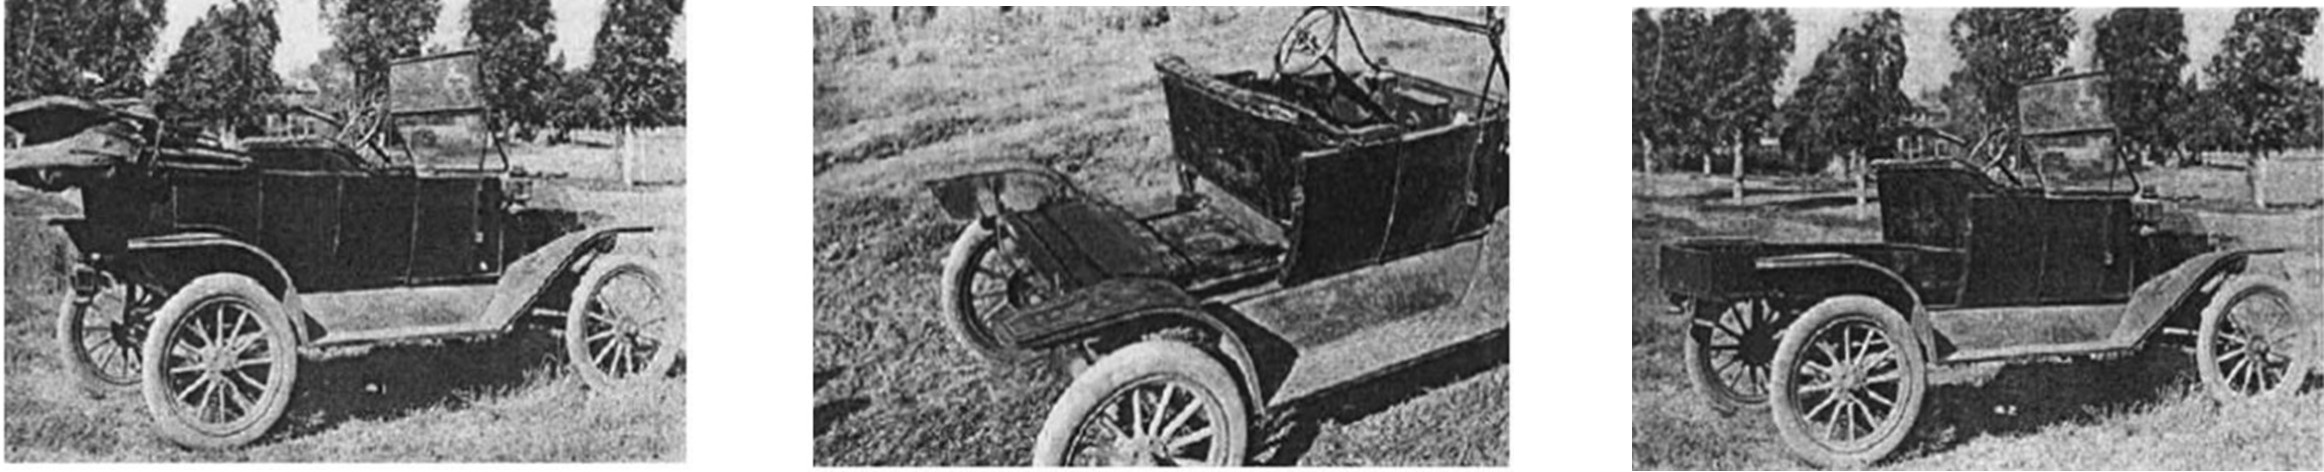
Although these minor details may seem trivial, their implications were anything but. The images below illustrate the importance of this common platform approach for producing Model Ts. While these are all clearly different vehicles, they were all variations of automobile bodies built upon the Model T common platform (pictured above).4
This is further exhibited in the progression below, which shows how a Ford Touring 4-seat car became a truck by removing the back of the car and replacing this section with a platform bed.
Henry Ford's Mass Customization
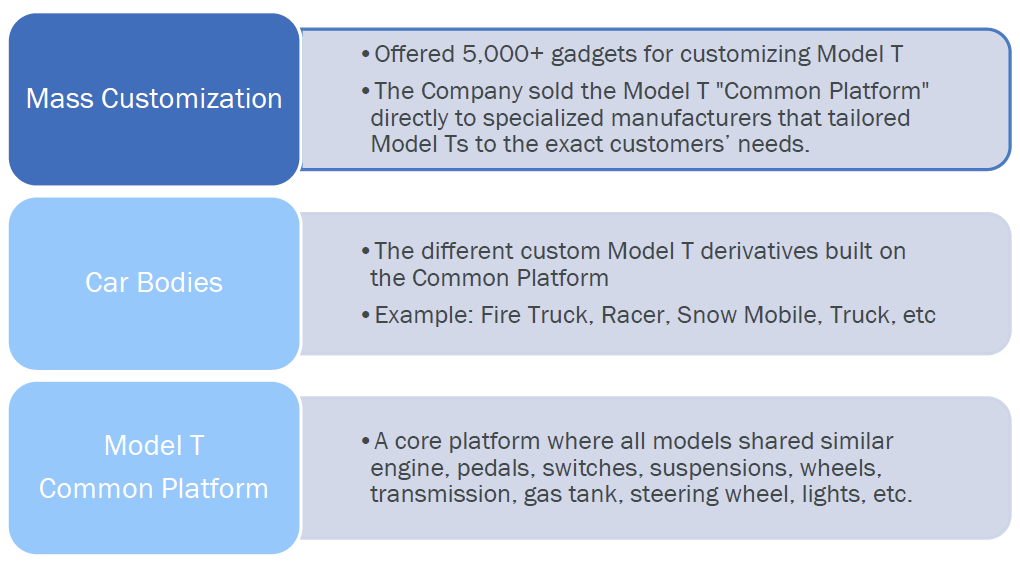
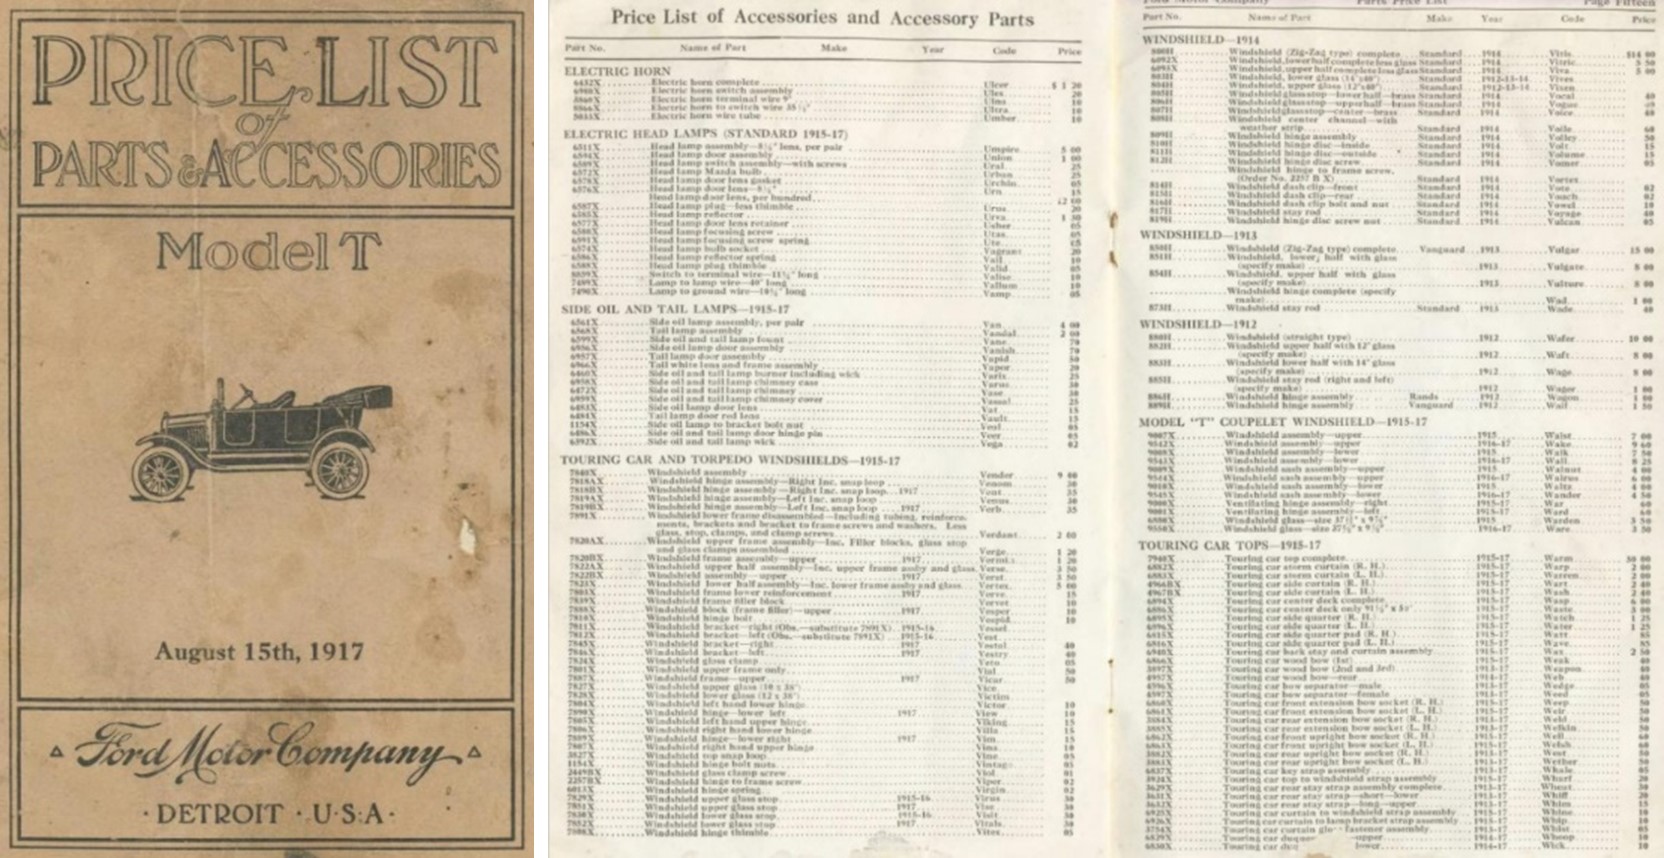
Ford’s common platform approach would be instrumental in the development of Mass Customization as it facilitated an easy customization process that was built upon a core foundation (the Model T platform). The Ford Motor Company spurred mass customization in two ways. First through offering customers 5,000 gadgets and accessories to choose from for customizing their vehicle in the same way that car companies offer different “accessory packages” today.
The additional – and more interesting – method of customization that Ford facilitated was offering the platform as a product to other specialized manufacturers, who could utilize their unique skillsets to customize automobiles to their client’s exact needs:
“The second way to offer variety was to sell the common platform directly. The customization was realized by Ford but mainly by specialized companies tailoring it to exact customers’ needs. This action ensured that mass production and mass customization generated thousands of unique vehicles during the lifecycle of the Model T…
Jiao and Tseng define mass customization as a strategy for offering individual customer’s needs yet maintaining near mass production efficiency. We consider what Henry Ford did, by manufacturing a core product and tailoring each product through specialized manufacturers, fit the definition of Jiao and Tseng. This approach also matches Duray’s assertion that mass customization must involve the customer in the design process. Finally, Ford’s approach also matches Pine’s definition who declares that a platform can facilitate addressing different market niches through derivative products...
This approach, to sell the platform as a product, was possible because of the separation between the common underbody (platform) and the derivative bodies (hats). Mass customization was also possible because this platform was significant and sufficient by itself being the entire underbody. As a result, the platform was already almost a car, which needed to be body-customized.”
MASS CUSTOMIZATION IN THE AGE OF INFORMATION: CUSTOM INDEXING
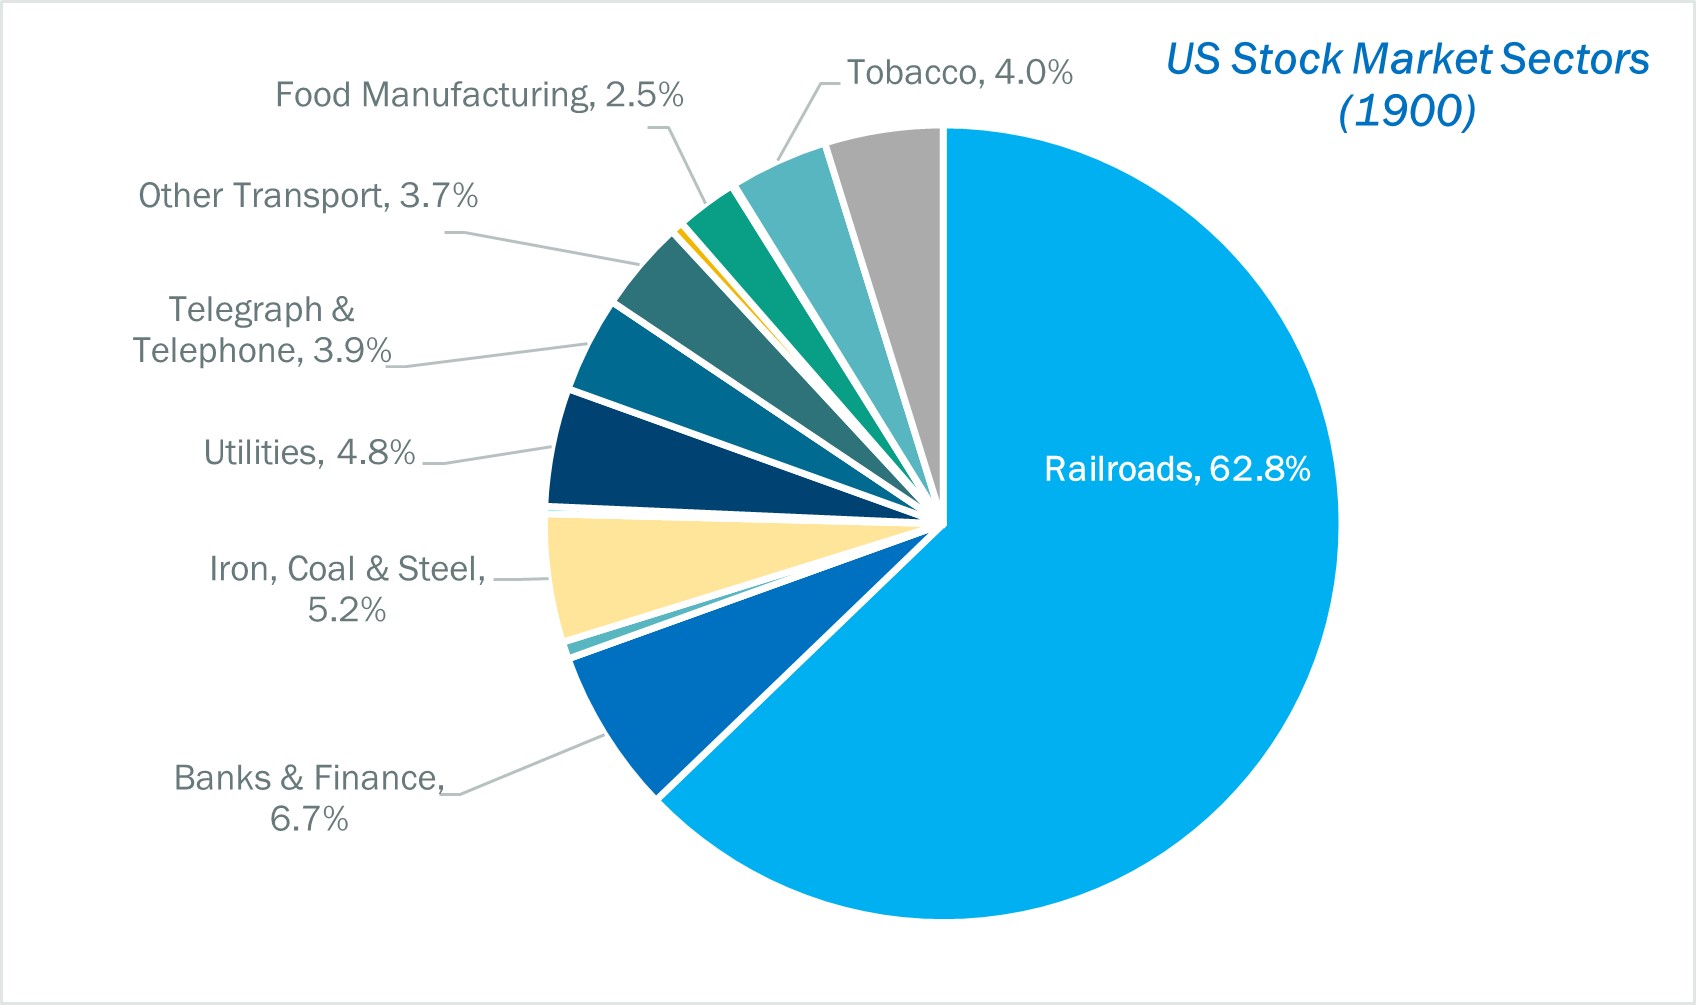
In 1900 – just eight years before the launch of Henry Ford’s Model T – the US stock market was dominated by industrial sectors like Railroads, which comprised 63% of the market.5
Today, the market is obviously quite different. Sectors that did not even exist 100 years ago, like Information Technology, now represent almost 30% of the market (as measured by the Russell 3000). Despite clear differences in the types of companies operating in each respective period, there are similarities in how they leveraged technology and innovative platforms to produce goods and services at a greater scale, more efficiently, and increasingly customized.
The Rise of Financial Technology
Over the last three decades there has been an incredible boom in technology and software powered by a range of innovations like the internet, cloud computing, e-commerce, smart phones, social media, and more. While these innovations have largely occurred within sectors like Information Technology, the experience of recent years has demonstrated that we are following the trajectory of previous “technological revolutions” in which these previously sector-siloed innovations are diffused across the economy into sectors like Financials (enter FinTech).
Coupled with advancements within the financial industry – introduction of ETFs, online brokerages, and commissions-free trading – there are thousands of FinTech companies trying to combine the innovations in Tech and Financials into powerful new products. A recent report by Deloitte on investment in the FinTech space highlights this trend:
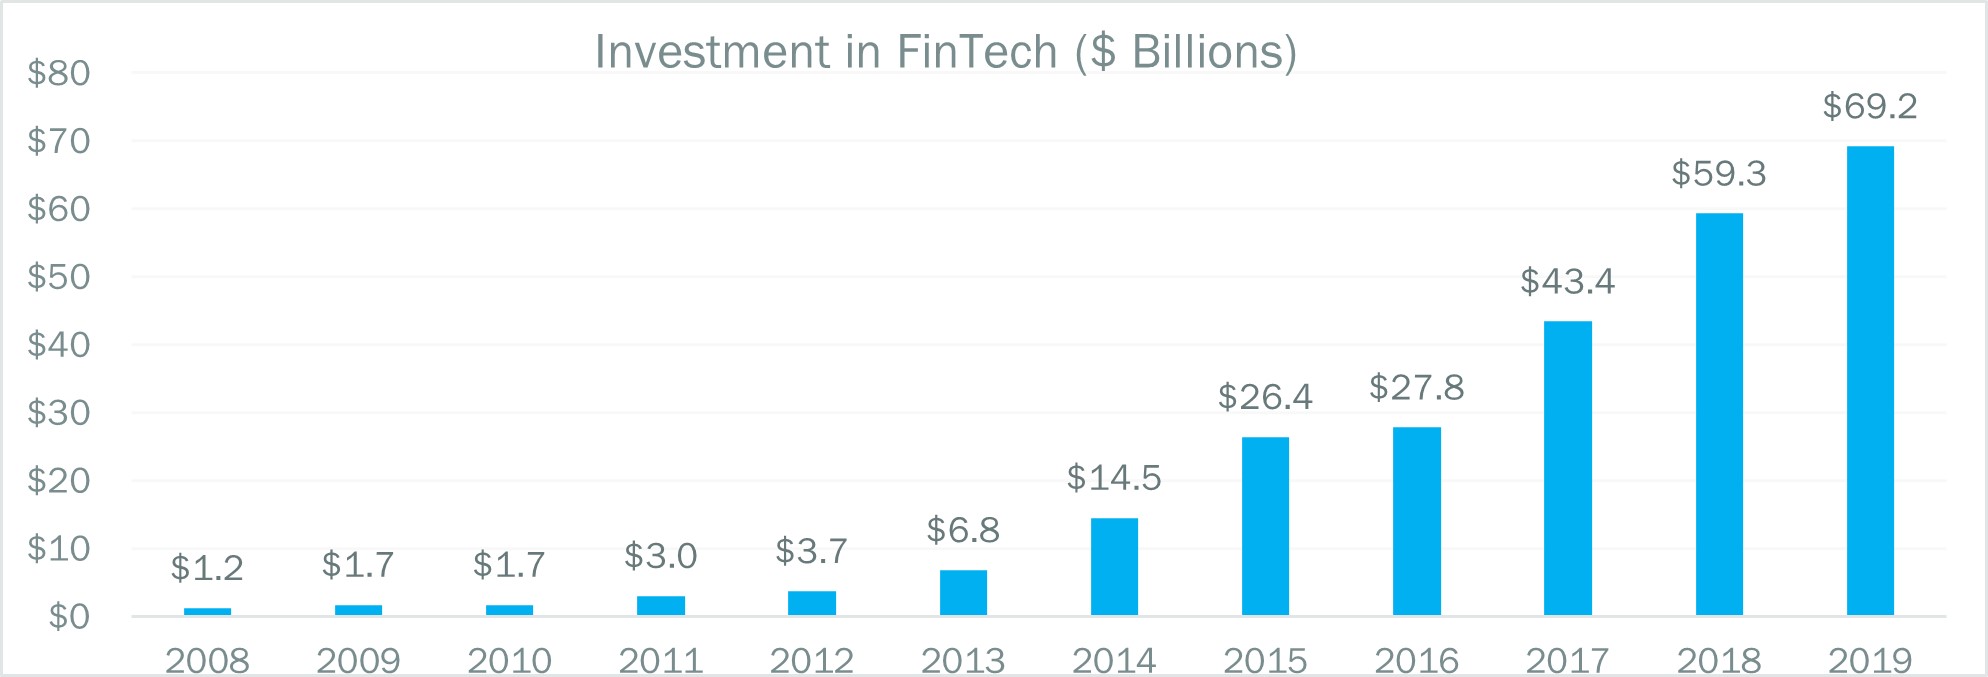
As market access becomes cheaper and easier than ever with the rise of mobile applications and fee compression in passive ETFs, market beta has quickly been commoditized. History demonstrates that commoditization tends to increase demand for customization. All consumers and investors are unique individuals, so how does it make sense that we would all invest our money in the same ETF with a singular objective?
Most of us yearn for customization in other aspects of life, like when purchasing an automobile (whether it be a Ford Model T or a Tesla Model Y), and innovations in financial software are finally enabling that same level of granular customization within the asset management industry.
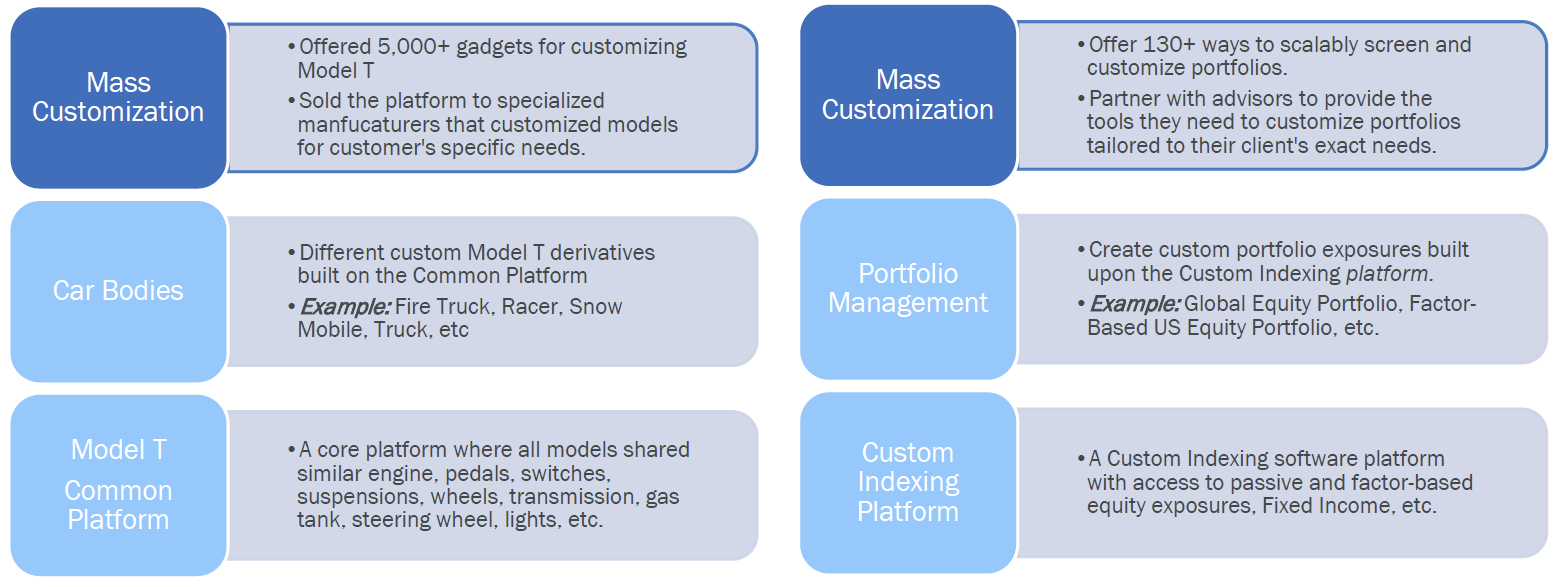
Custom Indexing: A Platform for Mass Customization
Referring back to the Model T common platform, we can compare the similarities between Henry Ford’s platform for mass customization and the modern example of Custom Indexing:
CONCLUSION
In the early 20th century, innovations like the moving assembly line championed by Henry Ford altered the manufacturing process forever by introducing the concept of mass production. Along with new technologies and a management philosophy increasingly dominated by science and efficiency (i.e., Frederic Taylor’s Scientific Management principles), new products like the automobile were produced efficiently at scale.
Although he is often incorrectly remembered for his “have it in black” quote, Henry Ford pioneered mass customization at a magnitude never seen before. Once again leveraging technology and a platform-based approach that allowed for customization built on top of common platforms, the Ford Motor Company was able to offer customized vehicles in a scalable way because the underlying platform of each vehicle remained the same.
In an age when passive beta and market access is cheaper and easier than ever, paired with rapid innovations in software and technology, the stage was set for forward-thinking asset managers to build platform-based products enabling mass customization.
As an experienced quantitative asset manager that has invested client money for decades leveraging cutting-edge technology, we at OSAM built a Custom Indexing platform that provided our own “Model T platform” (passive / factor-based exposure, innovative technology and software, investment expertise) for advisors to manage portfolios built upon this underlying platform. From there, 130+ additional customizations can be incorporated to tailor portfolios to each client’s exact needs. Through software and technology, this is all done at scale.
Henry Ford’s Model T had one of the longest production runs of any car in history, and its legacy lives on today. Time will tell if this era of innovation in finance and technology is remembered similarly in the annals of history, but OSAM is proud to provide mass customization in portfolio management through our Custom Indexing platform: Canvas®.
Footnotes
1 Tomac, N., Radonja, R., i Bonato, J. (2019). 'Analysis of Henry Ford’s Contribution to Production and Management ', Pomorstvo, 33(1), pg. 33-45
2 Fabrice Alizon, Steven Shooter, Timothy Simpson, “Henry Ford and the Model T: Lessons for Product Platforming and Mass Customization”, Design Studies, Vol. 30 (2009)
3 Ibid.
4 Ibid.
5 Dimson, Elroy; Marsh, Paul R; Staunton, Michael, Triumph of the Optimists: 101 Years of Global Investment Returns (Princeton, 2002)
GENERAL LEGAL DISCLOSURES & HYPOTHETICAL AND/OR BACKTESTED RESULTS DISCLAIMER
The material contained herein is intended as a general market commentary. Opinions expressed herein are solely those of O’Shaughnessy Asset Management, LLC and may differ from those of your broker or investment firm.
Please remember that past performance may not be indicative of future results. Different types of investments involve varying degrees of risk, and there can be no assurance that the future performance of any specific investment, investment strategy, or product (including the investments and/or investment strategies recommended or undertaken by O’Shaughnessy Asset Management, LLC), or any non-investment related content, made reference to directly or indirectly in this piece will be profitable, equal any corresponding indicated historical performance level(s), be suitable for your portfolio or individual situation, or prove successful. Due to various factors, including changing market conditions and/or applicable laws, the content may no longer be reflective of current opinions or positions. Moreover, you should not assume that any discussion or information contained in this piece serves as the receipt of, or as a substitute for, personalized investment advice from O’Shaughnessy Asset Management, LLC. Any individual account performance information reflects the reinvestment of dividends (to the extent applicable), and is net of applicable transaction fees, O’Shaughnessy Asset Management, LLC’s investment management fee (if debited directly from the account), and any other related account expenses. Account information has been compiled solely by O’Shaughnessy Asset Management, LLC, has not been independently verified, and does not reflect the impact of taxes on non-qualified accounts. In preparing this report, O’Shaughnessy Asset Management, LLC has relied upon information provided by the account custodian. Please defer to formal tax documents received from the account custodian for cost basis and tax reporting purposes. Please remember to contact O’Shaughnessy Asset Management, LLC, in writing, if there are any changes in your personal/financial situation or investment objectives for the purpose of reviewing/evaluating/revising our previous recommendations and/or services, or if you want to impose, add, or modify any reasonable restrictions to our investment advisory services. Please Note: Unless you advise, in writing, to the contrary, we will assume that there are no restrictions on our services, other than to manage the account in accordance with your designated investment objective. Please Also Note: Please compare this statement with account statements received from the account custodian. The account custodian does not verify the accuracy of the advisory fee calculation. Please advise us if you have not been receiving monthly statements from the account custodian. Historical performance results for investment indices and/or categories have been provided for general comparison purposes only, and generally do not reflect the deduction of transaction and/or custodial charges, the deduction of an investment management fee, nor the impact of taxes, the incurrence of which would have the effect of decreasing historical performance results. It should not be assumed that your account holdings correspond directly to any comparative indices. To the extent that a reader has any questions regarding the applicability of any specific issue discussed above to his/her individual situation, he/she is encouraged to consult with the professional advisor of his/her choosing. O’Shaughnessy Asset Management, LLC is neither a law firm nor a certified public accounting firm and no portion of the newsletter content should be construed as legal or accounting advice. A copy of the O’Shaughnessy Asset Management, LLC’s current written disclosure statement discussing our advisory services and fees is available upon request
The risk-free rate used in the calculation of Sortino, Sharpe, and Treynor ratios is 5%, consistently applied across time
The universe of All Stocks consists of all securities in the Chicago Research in Security Prices (CRSP) dataset or S&P Compustat Database (or other, as noted) with inflation-adjusted market capitalization greater than $200 million as of most recent year-end. The universe of Large Stocks consists of all securities in the Chicago Research in Security Prices (CRSP) dataset or S&P Compustat Database (or other, as noted) with inflation-adjusted market capitalization greater than the universe average as of most recent year-end. The stocks are equally weighted and generally rebalanced annually
Hypothetical performance results shown on the preceding pages are backtested and do not represent the performance of any account managed by OSAM, but were achieved by means of the retroactive application of each of the previously referenced models, certain aspects of which may have been designed with the benefit of hindsight
The hypothetical backtested performance does not represent the results of actual trading using client assets nor decision-making during the period and does not and is not intended to indicate the past performance or future performance of any account or investment strategy managed by OSAM. If actual accounts had been managed throughout the period, ongoing research might have resulted in changes to the strategy which might have altered returns. The performance of any account or investment strategy managed by OSAM will differ from the hypothetical backtested performance results for each factor shown herein for a number of reasons, including without limitation the following:
- Although OSAM may consider from time to time one or more of the factors noted herein in managing any account, it may not consider all or any of such factors. OSAM may (and will) from time to time consider factors in addition to those noted herein in managing any account.
- OSAM may rebalance an account more frequently or less frequently than annually and at times other than presented herein.
- OSAM may from time to time manage an account by using non-quantitative, subjective investment management methodologies in conjunction with the application of factors.
- The hypothetical backtested performance results assume full investment, whereas an account managed by OSAM may have a positive cash position upon rebalance. Had the hypothetical backtested performance results included a positive cash position, the results would have been different and generally would have been lower.
- The hypothetical backtested performance results for each factor do not reflect any transaction costs of buying and selling securities, investment management fees (including without limitation management fees and performance fees), custody and other costs, or taxes – all of which would be incurred by an investor in any account managed by OSAM. If such costs and fees were reflected, the hypothetical backtested performance results would be lower.
- The hypothetical performance does not reflect the reinvestment of dividends and distributions therefrom, interest, capital gains and withholding taxes.
- Accounts managed by OSAM are subject to additions and redemptions of assets under management, which may positively or negatively affect performance depending generally upon the timing of such events in relation to the market’s direction.
- Simulated returns may be dependent on the market and economic conditions that existed during the period. Future market or economic conditions can adversely affect the returns.