Microcaps — Factor Spreads, Structural Biases, and the Institutional Imperative
By Ehren StanhopeAugust 2017
There is an irony in the proliferation of “factor”-based strategies in recent years. An overwhelming majority of these strategies are launched in the most competitive arena for any financial market in the world — U.S. large cap equity. While factors can be effective in large cap, discerning investors will find the research in eclectic corners of the market, like microcap, dramatically more compelling. Though there are many unique considerations as it relates to liquidity and tradability, as factor investors who constantly seek ways to tilt the probabilities of investment success in the investor’s favor, we simply can’t look away from the opportunity that capacity constrained corners of the market provide.
Microcap stocks represent a fraction of the total U.S. market —around 1.2% of total capitalization. These stocks are under-covered, unloved, and under-owned, which presents dedicated investors with a unique opportunity. Since the late 1990s, microcap’s share of the total U.S. equity market has been cut in half — though it was small to begin with. A key culprit, the proliferation of passive and “smart beta” investment products has resulted in disproportionate flows into the large cap space and, therefore, away from small and microcap stocks.
The intent of this paper is to explain microcap’s inefficiency beyond merely the lack of institutional ownership and sell-side analyst coverage. We begin by reviewing the Russell definition of microcap, then refining that definition to hone in on pure microcap stocks. We explore the composition of the microcap universe to shed light on why it is a less competitive space, and then provide a framework for quality assessment and alpha generation. We close with an argument for the persistence of alpha in the space, based on structural barriers to scale.
What is Microcap?
Russell defines the microcap space using an ordinal ranking methodology. Whereas the Russell 1000® (R1000) consists of the 1,000 largest stocks in the U.S., the Russell 2000® (R2000) contains those ranking from 1,001 to 3,000. The Russell Microcap® Index overlaps with the R2000 since it includes the 2,001st to 4,000th ranked stocks. Russell has conveniently created some overlap to prevent index churn — buying and selling constituents frequently crossing over between index thresholds — because there tends to be a lot of movement in the ranking of stocks at the lower end of the market cap spectrum.
Since these indexes are market cap-weighted, owning the Russell Microcap index is much the same as owning a small tail of the R2000 plus a minor allocation to even smaller names. There is an 88% overlap between the Russell Microcap Index with the R2000. Based on monthly observations from 1982–2016, the correlation of return between the two indexes is 0.96. (Yet, the relevant iShares Russell ETF [IWC] carries a 0.60% expense ratio — three times higher than the fee of its Russell 2000 counterpart [IWD], which costs just 0.20%.)
A similar picture emerges when reviewing the share of dollar volume in each index. These tables summarize the allocation of the total U.S. market, based on capitalization and dollar volume across the indexes:
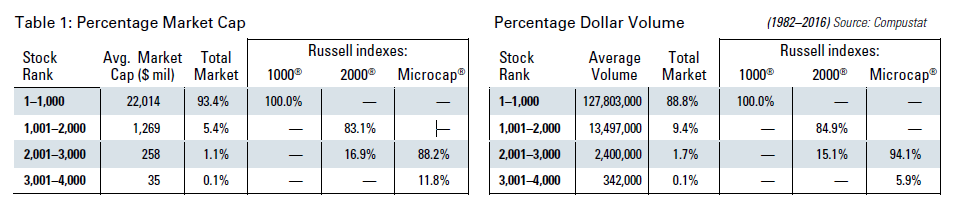
Notice that average dollar volume declines exponentially as you move away from large cap. Also, the small, unique portion of the Russell Microcap index (stocks ranked 3,001st through 4,000th) represents half the dollar volume weight as it does the market cap weight. Low volumes in this corner of the market can lead to significant transaction costs if not managed appropriately. This suggests that the cost of exposure to that small tail is very expensive, and likely a drag on performance of the index. In our own analysis over the period from 1982 through 2016, we found that applying a liquidity floor of $100K average daily volume (inflation-adjusted) improved the index return by 0.8%.
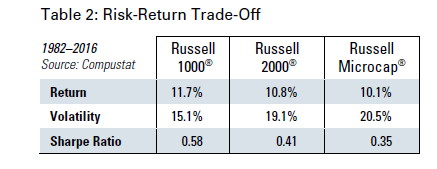
In current form, the performance statistics for microcap certainly do not drive a compelling narrative for adding an allocation to portfolios. The risk-return trade-off is poor enough that commonly used covariance optimization techniques in an institutional asset allocation study would suggest a zero-percent weighing to microcap. In fact, most would suggest little or no weight to the small cap R2000 as well. Given these results, it’s little wonder large cap stocks are all the rage.
For the rest of this paper, we diverge from the Russell index definitions to get a better sense of the composition of microcap and the alpha opportunity available. We define microcap stocks as those trading on U.S. exchanges with an inflation-adjusted market capitalization between $50 million and $200 million.1 Also, our microcap universe is equal-weighted, not cap-weighted. We believe this provides a “pure” view of the microcap market that has minimal overlap with small cap stocks. This group of about 1,300 stocks represents a disproportionately small 0.4% of total U.S. market capitalization. With average daily volume of just $700K per stock and a cumulative market cap of about $100 billion, the group is a mixture of exciting growth opportunities on the one hand, and the Land of Misfit Toys on the other. Once we screen out companies with unreasonable liquidity and non-U.S. domiciled firms (ADRs), the list dwindles to about 500 investable stocks.
For comparative purposes, we periodically refer to a Large Stocks universe. Large stocks comprise U.S. firms with a market capitalization greater than the average capitalization for the total market (currently those stocks above an inflation-adjusted $7 billion market cap). Large stocks are instructive as they represent the bulk of investor’s U.S. equity allocation. It is analogous to the S&P 500 Index on an equal-weighted basis.
Unique Aspects of the Microcap Universe
An investor cannot fully appreciate the microcap space without understanding how stocks have come to fall on the microcap spectrum. Whereas, most large stocks have succeeded in attempts to grow their businesses, as recognized by their multi-billion-dollar valuations, microcap stocks are on a completely different playing field. These businesses range from biotech startups to failing businesses that have depreciated to their current middling market cap. From an empirical perspective, the result is a lot of noise in the data.
To demonstrate, let’s look at one of a firm’s most fundamental metrics: sales growth. Though its efficacy as an investment factor is marginal, sales are the lifeblood of any firm and have a cascading effect on all other elements of their financial statements. This chart compares the distribution of three-year sales growth across large and microcap stocks:
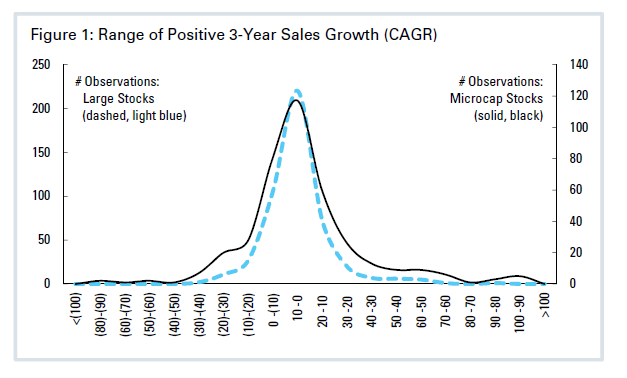
Notice the significantly fatter tails for microcap relative to large stocks. If growth in sales is the most basic assessment of the state of a firm, then this suggests much greater dispersion in the underlying metrics of microcaps. Popular rhetoric denounces small and microcap stocks as being junkier than their large cap counterparts. While this is true on average, a wide dispersion in fundamental metrics means that many phenomenal businesses get hidden behind a wall of meaningless averages.
A deeper dive reveals a disparate group of continually evolving — and devolving — businesses
Investors have widely accepted that there exist many different types of private equity: Angel Investing, Venture, Early Stage, Late Stage, Mezzanine, LBOs, and Distressed. Interestingly, in the private space, these labels represent the need of the firm receiving the investment. Just as there are many sub-classes of venture capital and private equity, such is the case with microcap stocks, but for whatever reason, we do not view these businesses with the same categorical lens as we do private investments.
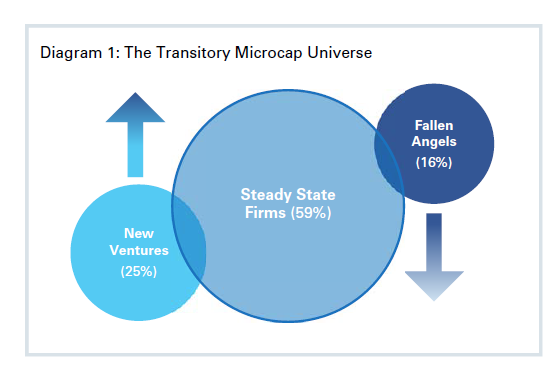
The microcap universe can be divided into three broad categories: (1) New Ventures that have become revenue-generating within the past three years, (2) distressed Fallen Angels that have descended into the microcap universe from small cap — and sometimes large cap — and (3) those in a Steady State (microcaps for at least 3 years).
From 1982 through 2016, New Ventures represented 25% of the microcap universe, while 16% were Fallen Angels, and 59% were Steady State. Effectively, 41% of the universe is in some sort of transition — ranging from startup to established firm, or from established firm to potential liquidation. When you think about microcap, think of a revolving door where firms are constantly entering and leaving for different reasons.
This simplistic perspective on the universe is relevant because it sheds light on the strong inherent biases that skew the underlying fundamental characteristics. Below is the same distribution of sales growth for microcap, broken down by these three categories.2 These disparate groups possess fundamentally different metrics that obscure a lot of noise in microcap stocks when averaged together.
New Ventures, with their small sales bases, are highly skewed towards positive sales growth. Unsurprisingly, New Ventures tend to be comprised of Information Technology and Health Care stocks — most notably biotech, software, and pharmaceuticals. Currently, these industries represent a rather large 20% of the microcap universe. The average annualized return of this group from 1982–2016 is 4.7%, woefully short of the microcap universe average of 8.9%. Adding insult to injury, annualized volatility for this group is 27.8%; likely a result of the nature of outcomes in the space. Biotech firms generally succeed or fail, in what amounts to binary outcomes — leaving investors with strong gains or staggering losses.
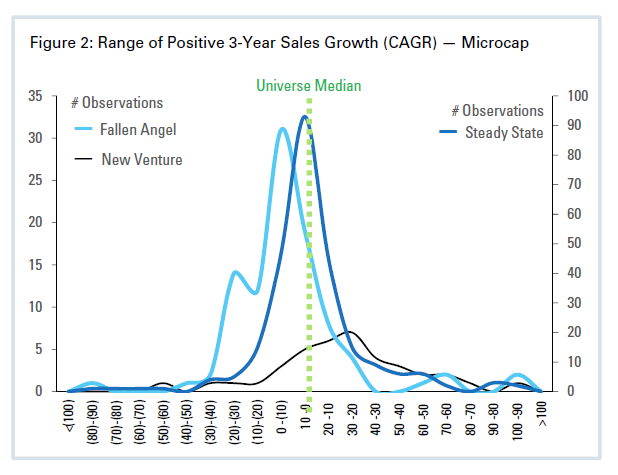
Steady State firms are more centered in the distribution, but still positively skewed. At 60% of the overall universe, a good proportion of Steady State firms are Commercial Banks and Thrifts. These two industries represent 20% of the universe currently. Banks are the least volatile microcap industry and one of the top performers. The remainder of firms in this category tend to be widely dispersed across industries. Steady State firms are the highest performing of the three categories with an annualized return of 10.1% and volatility of 22.8%.
Fallen Angels skew significantly in the negative growth direction. This group is a smattering of firms across industries. Currently, the oil & gas industry has the highest representation in this category. It tends to offer representative groups of stocks that suffered in the previous cyclical business downturn. This group delivered an annualized return of 8.0% from 1982–2016 with volatility of 27.4%.
As factor investors, our task is to develop empirical criteria that enable us to cut through the noise to separate the good from the bad. Given the perspective above, we know that there are reasonable fundamental explanations for the “junk-ish” nature of microcap stocks. Quite simply, a lot of microcap stocks possess poor business characteristics, whether that be weak cash flow generation, too much leverage, or dwindling and unprofitable revenues. By categorically identifying and removing firms with poor characteristics, we can improve the investor’s base rate for success.
Leveling the playing field
We’ve established that the fundamental drivers of microcap businesses are widely varied, at least in part, due to their state of being — New Venture, Steady State, and Fallen Angel. Let’s take a step back to build intuition for stock selection regardless of category. In our research, we have found several quality metrics to be indicative of good businesses. Generally, businesses should be profitable, growing at a reasonable pace, and appropriately capitalized. Individually, these metrics are effective, but when used together thematically, they provide a powerful framework for eliminating poorquality stocks. The table on the previous page compares several characteristics for Large and Microcap stocks.
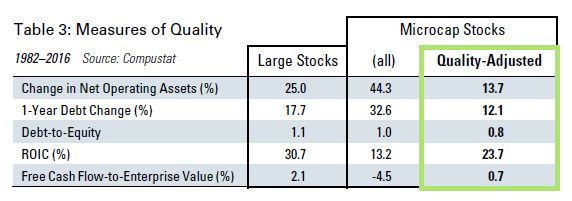
In each case, a simple average of characteristics for microcap stocks betrays the universe’s lower quality nature relative to Large Stocks. One would assume from looking at the microcap column that these businesses are rapidly growing their asset base, not particularly profitable, taking on tremendous debt, and generating negative free cash flow. All these signals seem to indicate a hunger for cash.
Change in Net Operating Assets (NOA) measures the growth in assets required to run the business. If a small consumer products company, for example, hit the jackpot with a new contract at a huge retailer and then had to ramp up production to fulfill the order, this metric would increase. Sales growth requires large investment for raw materials, inventory, delivery of finished goods, and equipment for ongoing production. The challenge with growth is that it requires huge cash outlays. This cash is all outlaid before revenue occurs. Dramatic growth in operating assets can be indicative of stress, as it leaves the business in a tenuous cash position. This state of affairs seems to be the norm for microcap stocks with an average change in NOA of 44.3% — almost double the rate for large stocks.
Few small firms have enough internal capital to fund such large investments. They then turn to capital providers to fund growth — issuing equity offerings, or taking on debt. Keep in mind that many microcap stocks have no analyst coverage, so the ability to tap equity capital markets is limited and expensive.3 Debt becomes the default source of capital. The average one-year change in debt for the universe is 32.6%, and debt-to- equity is on par with Large Stocks. The ROIC of just 13.2% indicates that capital, of which debt is a part, is not being as efficiently invested as with Large Stocks. A free cash flow yield of -4.5% suggests economic value is being destroyed, rather than created.
Each of these characteristics are components of multi-factor themes that we use to assess the quality of a firm: Earnings Quality (NOA), Financial Strength (D/E, Change in Debt), and Earnings Growth (ROIC).4 To level the playing field for comparison to Large Stocks, we can rank stocks in the microcap universe based on these multi-factor themes and eliminate the lowest ranking decile. Firms falling into these groups tend to be poorly capitalized and have low profitability and weak earnings quality.
By adjusting the microcap universe, the overall metrics dramatically improve, and in some cases, are actually better than Large Stocks. Quality-adjusted microcap stocks reveal much more moderate growth rates in NOA. An average 13.7% is indicative of businesses that are more likely to handle organic business growth without needing to seek substantial funding from debt or equity issuance. The improvement in the 1-Year Debt Change metric after adjusting for quality supports this logic. A large 32.6% increase in debt decreases to just 12.1% — lower than the average for Large Stocks.
Clearly, the universe quality metrics have improved, but how does this translate into investor returns? It turns out that eliminating poor quality boosts the return of our universe by 5.3% annualized with a 0.7% reduction in annual volatility, as shown in this table:
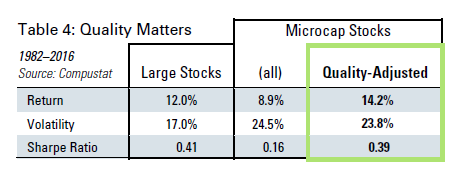
Incorporating quality criteria to eliminate stocks from consideration has a dramatic impact on microcap stocks. Performing a quality assessment highlights the importance of a less appreciated aspect of factor investing. While many researchers focus on the outperformance associated with factors, using factors to avoid groups of stocks can be just as positive a contributor to investor returns. After controlling for quality, the risk-adjusted returns available are inline with large stocks. Earlier we mentioned that the historical return and risk of the Russell Microcap® Index did not merit an allocation according to mean-variance optimization. This simple quality screen alters the space’s characteristics to such an extent that it becomes a viable source of differentiated return for investors.
Factor investing is more effective in Micro than in any other cap range
Though factor investing has rooted itself squarely in large cap equities, we believe it significantly more effective in small and microcap — the eclectic corners of the market. Thus far, we’ve used the quality themes of Financial Strength, Earnings Quality, and Earnings Growth to screen out stocks. Now we turn our focus to a broader suite of multi-factor themes by bringing in value and momentum to the portfolio. While value and momentum are also effective in negative screening (which stocks to avoid), they are most effective in identifying which stocks to select.
In an analysis of each multifactor theme’s performance from 1982 through 2016, we have found enormous differentials in the return spread between high- and low-ranking stocks. Spreads serve as a proxy for robustness of a factor. In the academic literature, these are hypothetical long-short portfolios that suggest the size of a systematic return premium.
In the table below, we show the spread between the return of high and low deciles in Large, Small, and Micro stocks on each theme. Using this lens, it is readily apparent that factors are more robust in micro than large — and even small — stocks. Within the microcap space, the smallest spread (Earnings Quality: 14.5%) is greater than the largest in Large Stocks (Value: 12.5%). This once again highlights the importance of quality in microcap. As measured by the spread, quality is 3⨉ to 4⨉ more significant in Micro than it is in Large Stocks.
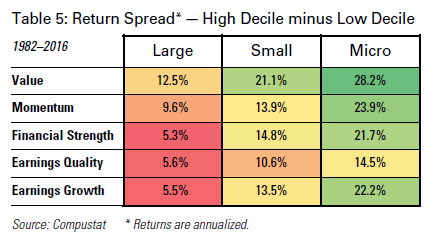
The spreads for Value and Momentum in micro are greater than twice the spread in Large Stocks. The Value spread in Micro suggests one could go long a portfolio of the cheapest stocks and short the most expensive to earn an eye-popping 28.2% annualized return. Practically, this would be virtually impossible due to the operational challenges and costs of managing the short side of a microcap portfolio. This realworld complexity necessitates a focus on generating return by not owning the lowest-ranked names, as opposed to shorting, and owning the highest-ranked names.
The table below continues our previous analysis of adjusting the microcap universe for quality by eliminating poorly-ranked names. To that group of stocks, the two rightmost columns display the results from owning only those names falling in the highest-ranked decile by Momentum and Value, respectively.
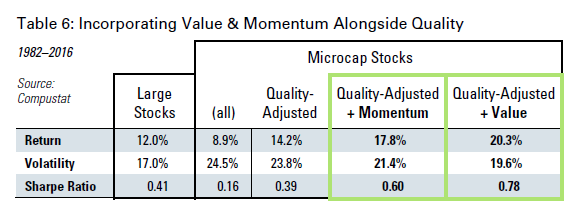
As was the case with quality adjustments, a focus on momentum improves return by 3.6% annualized with 10% lower volatility than the quality adjusted group. The addition of Value is even more compelling. A focus on Value improves return by 6.1% annualized with 17% lower volatility than the quality-adjusted group.
Structural features underpin the persistence of factors in Micro
While we wish we were the only ones aware of the massive spreads available in the Micro space, the reality is that this information is well known. In theory, it is curious that investors have not arbitraged this clear edge. In practice, real world implementation costs quickly erode theoretical alpha if not managed precisely. There are three inherent structural constraints to scale that hamper professional money managers, thus, protecting the persistence of alpha for dedicated investors at appropriate scale.
Transactable stock — SUPPLY
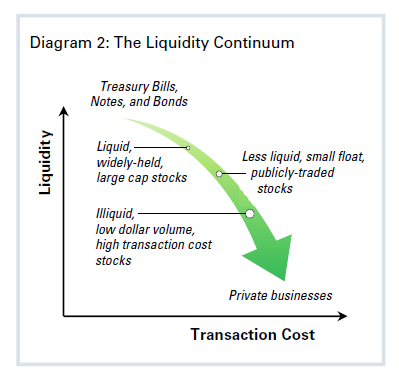
Liquidity can be thought of along a spectrum that ranges from the most liquid U.S. Treasury securities (T-bills) to illiquid private businesses (Private Equity). Moving to the illiquid end of the spectrum, the cost of implementation increases, magnifying the importance of expertise when transacting in scale. The primary considerations as it relates to implementation on the liquidity spectrum are free float and dollar volume of transactions.
“Float” is the number of shares that are freely available to trade. While a mega cap firm like Apple has a free float of 96% of its shares outstanding, microcap stocks tend to have the lowest free float as a percentage of the total shares of any market cap range. As of year-end 2016, microcap stocks had an average free float of just 72% of shares outstanding. Because of their stage in the business life cycle, microcaps commonly feature large ownership by founders and insiders, and relative to large stocks, could be considered closely held. This feature is important because it reduces the available supply of microcap stock to transact in by 28%. Given Apple’s 96% free float, $737 billion of its $767 billion market cap is freely tradeable. Within our microcap universe, just $72 billion of the $100 billion is freely tradeable. This curtails the size of any individual actor in the space, including large institutional investors and product providers.
Transactable stock — VOLUME
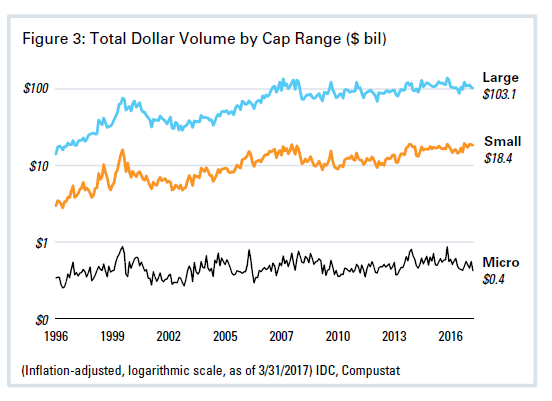
Dollar volume gives a sense of transaction velocity, and an investor’s ability to enter and exit the market at will. The chart below details total dollar volumes, adjusted for inflation, for Large, Small, and Micro stocks over the past 20 years. The dollar volume for Large and Small Stocks is 245⨉ and 43⨉ greater, respectively, than microcap. The relatively low $420 million total dollar volume for all microcap stocks suggests that an active manager employing similar strategies to the ones discussed in this paper would find it difficult to oversee strategy assets of significant size, while still being able to transact (as of 4/30/2017).
Transaction costs
While free float and volume constrain the ability to oversee a large amount of assets in the space, implementation costs erode theoretical factor spreads. At scale, these costs can be material. Real world costs have always been, and will likely continue to be, a barrier to entry at scale in less efficient spaces.
Investors must grapple with three costs of implementation: commissions, market impact, and bid-ask spreads. Fortunately, commissions have a relatively low impact on cost given the highly competitive nature of the brokerage business. Most institutional transactions occur at pennies per share (generally not relevant unless transacting in penny stocks). Commissions are the only true explicit and measurable cost. The more relevant and hidden share of costs are market impact and bid-ask spreads.
The chart below organizes the U.S. market into liquidity groups sorted from most to least dollar volume to assess the market impact and bid-ask spread of a hypothetical $10 million trade to get exposure to each liquidity group. Overlaid on the chart is the measure of dollar volume across the market. The horizontal axis is the average market cap for each liquidity bucket. From this, one can infer that dollar volume and market cap are highly positively correlated, while cost and dollar volume are clearly inversely correlated. Said another way, the smaller the stock, the lower the dollar volume, the more expensive to trade.
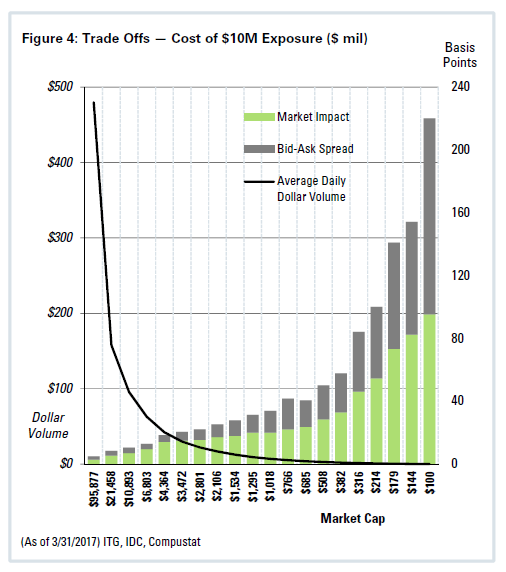
A $10 million trade could be implemented in the most liquid group of U.S. stocks for approximately 5 bps. Sophisticated trading techniques would likely neutralize this impact altogether as smart traders act as liquidity providers when establishing positions. This is made considerably easier with $480 million in average daily dollar volume with which to work the trade. Capacity in this part of the market is virtually unlimited. On the other end of the spectrum, stocks in the least liquid bucket bear an allin cost estimate of 220bps, a 44⨉ increase in cost on 99.97% lower dollar volume with which to trade. Again, sophisticated trading techniques could minimize, but in this case not eliminate, relevant costs. Capacity in this corner of the market is low, but alpha potential is massive.
Supply, volume, and cost act as significant barriers to scale in microcap. Not only do they require a specialized set of skills to implement portfolios in an efficient manner, they also require money managers to exercise restraint regarding strategy capacity.
Scale destroys alpha; alpha is expensive to realize
Objectively, the capacity of a given strategy is a function of supply, volume, and cost of implementation. Subjectively, and most importantly, capacity is determined by the investment manager’s desire for assets under
management. Increasing strategy capacity can often lead to conflicts of interest between the business necessity for fee generation and the client necessity for alpha generation. There is a dichotomy in the fact that less liquid microcap stocks require greater skill in implementation, while also requiring restraint in scale. From a product management perspective, the space is unappealing to large money management organizations because assetbased fees on low capacity strategies struggle to support the costs of dedicated teams.
It is not uncommon for micro and small cap managers to creep up the market cap spectrum in order to realize greater capacity. Moving up-market results in smaller factor spreads, and therefore, reduced opportunity for alpha generation. Another alternative is bearing greater market impact costs through larger trade sizes. Both are unappealing options. Static, however, are manager fees, which capture a greater proportion of alpha even as the effectiveness of factors are diluted.
Look Beyond Highly Competitive Markets for Factor Exposure
We’ve been conditioned for decades to believe that obvious anomalies will be arbitraged away. Most investors readily agree that alpha is scarce. It is hard to nd, highly sought after, and requires skill to extract. Based on this premise and the recent horrendous performance of active managers, many investors establish their beachhead in the most competitive portions of the equity market, large cap, where alpha is most scarce.
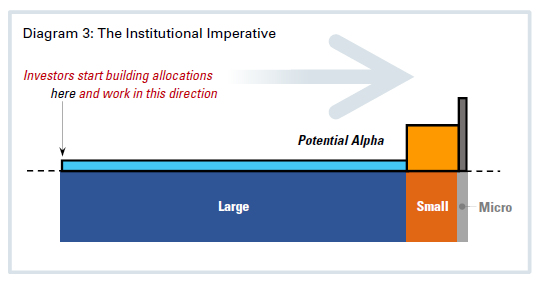
Though we often mock the Hollywood scene, we are just as guilty of stargazing. Institutions follow their peers like hawks, and research has shown that “herding” occurs among even the most sophisticated asset allocators.5 For a multi-billion-dollar plan, sheer size prevents them from accessing microcap. A $5 billion plan would probably need to make a $100 million allocation to microcap to make a difference to overall plan returns. That’s a large allocation to a constrained space. Going larger, a $30 billion plan? Forget about it! So, instead they pay massive fees for coveted, concentrated access to illiquid private equity markets where their edge cannot be arbitraged away — well, not as easily. Should smaller investors follow suit?
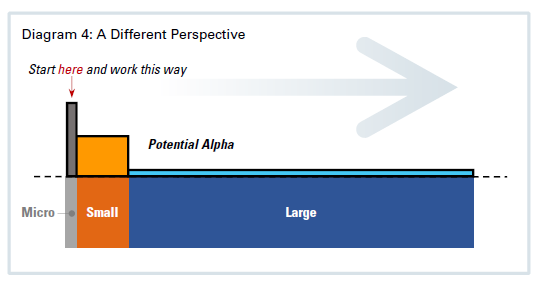
While large allocators face structural constraints, all else equal, this behavior doesn’t make sense for smaller investors. Just as business schools teach the intricacies of the Ef cient Market Hypothesis, students cross the courtyard for their next round of classes in …marketing strategy, corporate nance, competitive strategy, game theory, entrepreneurship… all of which are oriented toward identifying and exploiting strategic business advantage. Investors should start building allocations where competition is low and alpha is less scarce: microcap. Why not approach allocations from the non-institutional perspective?
At a time when the proliferation of factor investing is being driven by asset gatherers in highly-competitive spaces, astute investors likely find the research on factors in microcap quite enticing. We began by reviewing the Russell defnition of microcap and discovered that the majority (88%) of what Russell considers microcap is actually small cap. The inferior construction methodology of the index — simple market cap weighting — omits critical considerations for quality and the cost of implementation in microcap. This is important because the lackluster results of index returns fail to offer a compelling narrative for microcap in traditional mean-variance portfolio construction. We then explored the composition of the microcap universe to shed light on why it is a less competitive and lower quality space. A revolving door of New Ventures and Fallen Angels flank a core group of Steady State firms, which cause significant variability in the measurement of underlying stock fundamentals — often leading investors to write off the space as “a junkyard littered with poor-quality stocks.” We then honed in on pure microcap stocks that offer the potential for risk-adjusted return on par with large stocks through a framework for quality assessment. Significantly greater spreads (from 2⨉ to 3⨉) for the multi- factor stock selection themes of value and momentum in microcap — as compared to large and small stocks — fuel the potential for substantial value-add.
Based on the structural barriers of supply, volume, and implementation costs to scale, we believe there is a robust argument for the persistence of alpha generation in microcap. By breaking away from the institutional paradigm that is heavily aligned with the most competitive portions of the market, avoiding low quality, controlling implementation costs, and focusing in on stocks with strong momentum and value characteristics, we believe investors can realize substantial alpha in this capacity-constrained space.
General Legal Disclosures & Hypothetical and/or Backtested Results Disclaimer
The material contained herein is intended as a general market commentary. Opinions expressed herein are solely those of O’Shaughnessy Asset Management, LLC and may differ from those of your broker or investment firm.
Please remember that past performance may not be indicative of future results. Different types of investments involve varying degrees of risk, and there can be no assurance that the future performance of any specific investment, investment strategy, or product (including the investments and/or investment strategies recommended or undertaken by O’Shaughnessy Asset Management, LLC), or any non-investment related content, made reference to directly or indirectly in this piece will be profitable, equal any corresponding indicated historical performance level(s), be suitable for your portfolio or individual situation, or prove successful. Due to various factors, including changing market conditions and/or applicable laws, the content may no longer be reflective of current opinions or positions. Moreover, you should not assume that any discussion or information contained in this piece serves as the receipt of, or as a substitute for, personalized investment advice from O’Shaughnessy Asset Management, LLC. Any individual account performance information reflects the reinvestment of dividends (to the extent applicable), and is net of applicable transaction fees, O’Shaughnessy Asset Management, LLC’s investment management fee (if debited directly from the account), and any other related account expenses. Account information has been compiled solely by O’Shaughnessy Asset Management, LLC, has not been independently verified, and does not reflect the impact of taxes on non-qualified accounts. In preparing this report, O’Shaughnessy Asset Management, LLC has relied upon information provided by the account custodian. Please defer to formal tax documents received from the account custodian for cost basis and tax reporting purposes. Please remember to contact O’Shaughnessy Asset Management, LLC, in writing, if there are any changes in your personal/financial situation or investment objectives for the purpose of reviewing/evaluating/revising our previous recommendations and/or services, or if you want to impose, add, or modify any reasonable restrictions to our investment advisory services. Please Note: Unless you advise, in writing, to the contrary, we will assume that there are no restrictions on our services, other than to manage the account in accordance with your designated investment objective. Please Also Note: Please compare this statement with account statements received from the account custodian. The account custodian does not verify the accuracy of the advisory fee calculation. Please advise us if you have not been receiving monthly statements from the account custodian. Historical performance results for investment indices and/or categories have been provided for general comparison purposes only, and generally do not eflect the deduction of transaction and/or custodial charges, the deduction of an investment management fee, nor the impact of taxes, the incurrence of which would have the effect of decreasing historical performance esults. It should not be assumed that your account holdings correspond directly to any comparative indices. To the extent that a reader has any questions regarding the applicability of any specific issue discussed above to his/her individual situation, he/she is encouraged to consult with the professional advisor of his/her choosing. O’Shaughnessy Asset Management, LLC is neither a law firm nor a certified public accounting firm and no portion of the newsletter content should be construed as legal or accounting advice. A copy of the O’Shaughnessy Asset Management, LLC’s current written disclosure statement discussing our advisory services and fees is available upon request.
The risk-free rate used in the calculation of Sortino, Sharpe, and Treynor ratios is 5%, consistently applied across time.
The universe of All Stocks consists of all securities in the Chicago Research in Security Prices (CRSP) dataset or S&P Compustat Database (or other, as noted) with inflation-adjusted market capitalization greater than $200 million as of most recent year-end. The universe of Large Stocks consists of all securities in the Chicago Research in Security Prices (CRSP) dataset or S&P Compustat Database (or other, as noted) with inflation- adjusted market capitalization greater than the universe average as of most recent year-end. The stocks are equally weighted and generally rebalanced annually.
Hypothetical performance results shown on the preceding pages are backtested and do not represent the performance of any account managed by OSAM, but were achieved by means of the retroactive application of each of the previously referenced models, certain aspects of which may have been designed with the benefit of hindsight.
The hypothetical backtested performance does not represent the results of actual trading using client assets nor decision-making during the period and does not and is not intended to indicate the past performance or future performance of any account or investment strategy managed by OSAM. If actual accounts had been managed throughout the period, ongoing research might have resulted in changes to the strategy which might have altered returns. The performance of any account or investment strategy managed by OSAM will differ from the hypothetical backtested performance results for each factor shown herein for a number of reasons, including without limitation the following:
- Although OSAM may consider from time to time one or more of the factors noted herein in managing any account, it may not consider all or any of such factors. OSAM may (and will) from time to time consider factors in addition to those noted herein in managing any account.
- OSAM may rebalance an account more frequently or less frequently than annually and at times other than presented herein.
- OSAM may from time to time manage an account by using non-quantitative, subjective investment management methodologies in conjunction with the application of factors.
- The hypothetical backtested performance results assume full investment, whereas an account managed by OSAM may have a positive cash position upon rebalance. Had the hypothetical backtested performance results included a positive cash position, the results would have been different and generally would have been lower.
- The hypothetical backtested performance results for each factor do not reflect any transaction costs of buying and selling securities, investment management fees (including without limitation management fees and performance fees), custody and other costs, or taxes – all of which would be incurred by an investor in any account managed by OSAM. If such costs and fees were reflected, the hypothetical backtested performance results would be lower.
- The hypothetical performance does not reflect the reinvestment of dividends and distributions therefrom, interest, capital gains and withholding taxes.
- Accounts managed by OSAM are subject to additions and redemptions of assets under management, which may positively or negatively affect performance depending generally upon the timing of such events in relation to the market’s direction.
- Simulated returns may be dependent on the market and economic conditions that existed during the period. Future market or economic conditions can adversely affect the returns.