O’Shaughnessy Quarterly Investor Letter Q2 2018
By Patrick O’ShaughnessyJune 2018
Dear Investor,
In this quarter's letter, we're going to share our thoughts on three key topics: the Value factor’s extended run of poor performance, the ways we believe asset managers can borrow concepts from the technology sector, and our current research agenda.
The Value Winter
Is Value ever going to work again? Since 2010, the Russell 1000 Growth index has outperformed the Russell 1000 Value index by roughly 70%, leaving many investors wondering if Value’s historical edge will persist, or whether, instead, the future will be more random.
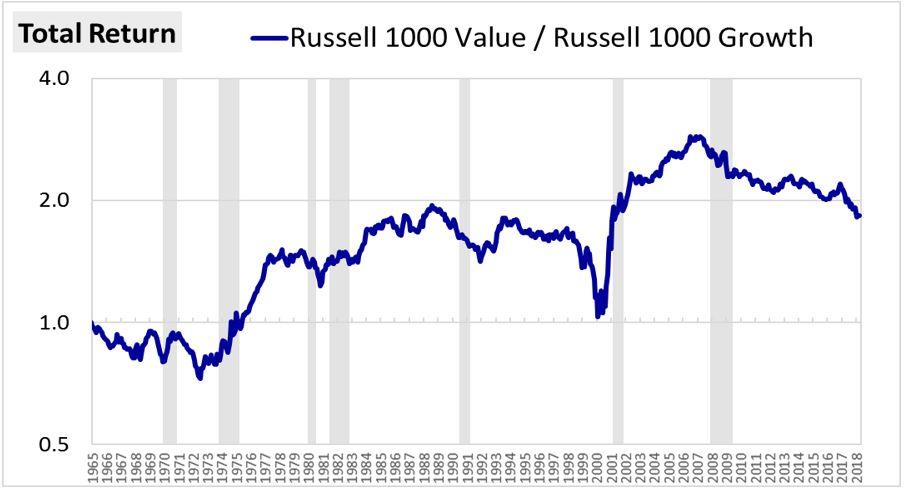
Since 2010, growth stocks like Apple, Amazon, and Facebook have dominated. Value stocks like Exxon, Bank of America, and Proctor and Gamble have lagged significantly.
But this has not been a trend concentrated among just a few stocks. Growth outperformed value in every single sector. The results were most pronounced in Energy, Tech, and Consumer Discretionary—but even within the Telecom, Materials, and Real Estate sectors, growth beat value. Here is the total effect within each sector (the result of stock selection and allocation):
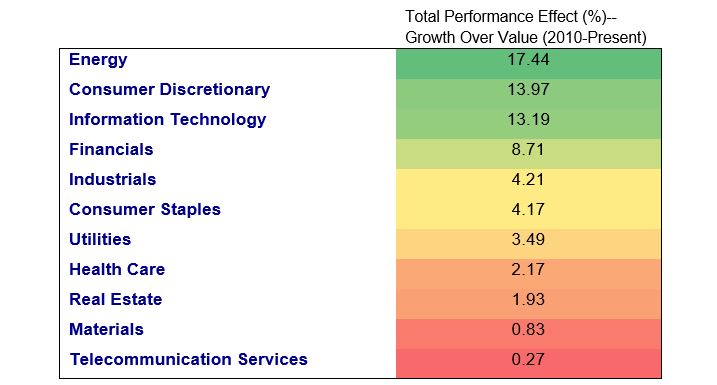
These sector results are only useful in hindsight, and there is almost no chance that the next 8 years will look the same. Still, they are a useful way of illustrating how pervasive this trend has been.
Perhaps a more interesting angle is to parse the drivers of returns using a framework we introduced in our paper “Factors From Scratch.”
It is difficult to explain fundamental performance within the Russell style indexes, because there is significant turnover each year. In this animation, we show in red companies which are switching indexes on rebalance dates, and in green companies which are entering into an index for the first time.

In Factors From Scratch, we introduced a method for decomposing index returns in the presence of that turnover. Specifically, we identified three sources of return for high-turnover indexes:
- Holding Period EPS Growth - growth in the underlying companies during the holding periods.
- Rebalancing EPS Growth - growth due to multiple expansion that gets removed from the index via rebalances back into cheaper stocks.
- End to End Valuation Changes - Valuation changes that do not get removed via rebalances, but that instead stay in the index over the entire period of the analysis.
Typically, growth stocks have much better holding growth, but trade into more expensive stocks on rebalances, resulting in poor rebalance returns1. Value stocks, by contrast, have weaker holding growth (the companies are often in distress), but make up for it via trading down into cheaper stocks and riding multiple expansion during the holding period.
Here is how the Russell indexes have looked over the very long term:
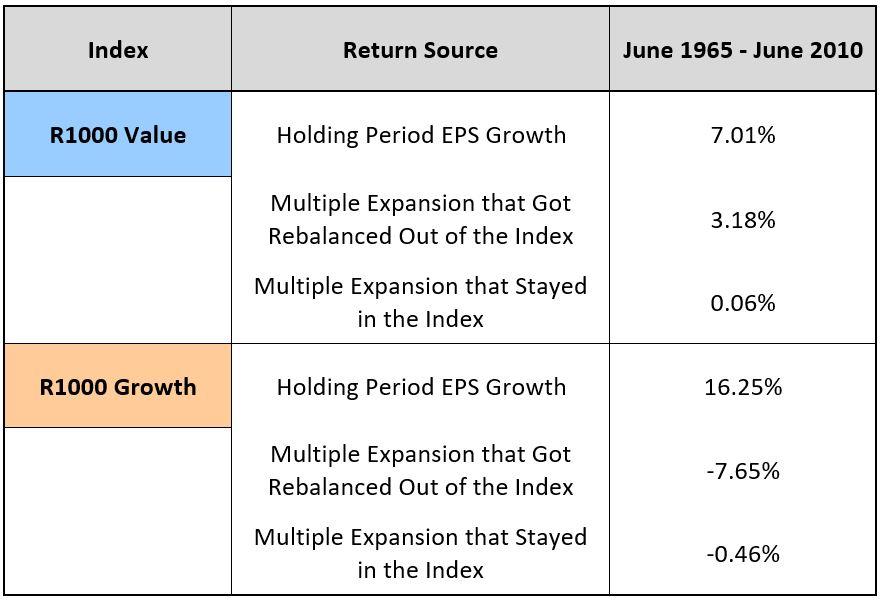
Notice the trade off. In the growth index, you “pay” for very strong holding growth with “expensive” rebalances: the Russell 1000 Growth, on average, trades into more expensive stocks. In the value index you “get paid” for owning weaker companies (not literally, of course, you just get to pay a cheaper multiple, which the market has historically re-rated higher in the year after purchase, delivering you a strong rebalance return). It would be great to get high growth at a cheap price, but it doesn’t work that way. There is a balance between value and growth. Historically that balance has slightly favored value.
But now look at this same data since June, 2010:
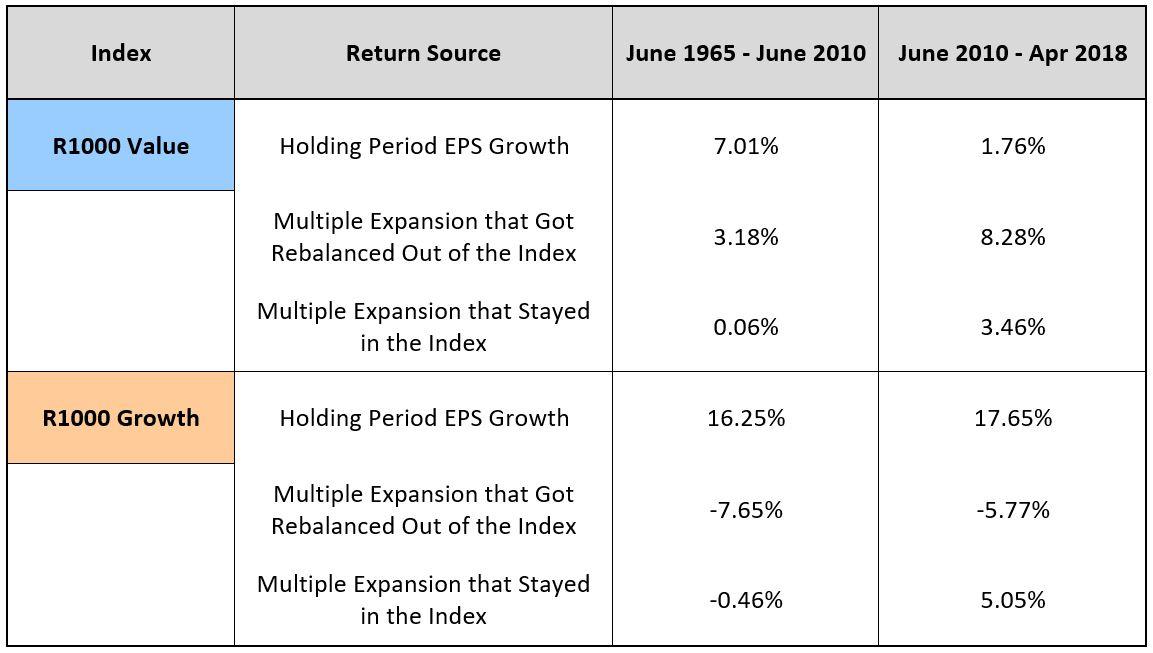
Even in a period of above average returns, value’s holding growth has been far worse than historic norms. Russell 1000 Value stocks have often been cheap for good reason. Think here of the major energy companies, like Exxon Mobil, which have represented among the largest weights in the index. Growth, meanwhile, has performed more in line with its historic norms, showing similar rebalancing and holding returns.
Both strategies have benefitted from strong end-to-end valuation changes, as the market is much more expensive in 2018 than it was in 2010. But relative to value, growth has benefitted more from this end-to-end multiple expansion, gaining an additional 1.5% per year (5.05% per year for growth vs. 3.46% for value from that effect). The higher return from end-to-end multiple expansion for the Growth index reflects the fact that it has received a boost from becoming become more expensive relative to history. If this increased expensiveness were to unwind going forward, the prior source of added return will turn into a drag.
As investors, we want to pay unfair prices for future per share fundamental growth and cash flows. If you knew future growth, you’d be an invincible investor (so long as you didn’t use leverage), because you could compare today’s prices with future growth and pick the better opportunities. Value has beaten Growth historically because while holding growth isn’t great, the price you pay for Value has been unfair (i.e., too low).
That has not held true since 2010. To summarize the findings through this lens: this period hasn’t been an abnormally strong run for growth companies. Instead, its been a very bad period for the EPS growth of value stocks.
The Future of Value
If the value factor is going to work in the future, it will be for the same reasons that it has worked in the past: rebalancing return (our way of tracking multiple expansion across rebalances) will prove strong enough to overcome relatively lower holding growth. The ability to swap into cheaper stocks at each rebalance and hold as their multiples expand will make up for weaker holding return and lead to real excess return. The conditions for strong rebalance growth are present in today’s market. What remains unknowable is whether the cheapest stocks will continue to have very weak growth during the holding period.
While we’ve spent a lot of time thinking about value, it is important to note that we don’t advocate single factor investing. We believe better results come when you thoughtfully combine many signals into an overall model, and construct a portfolio with much more rigor than the “highest ranking quintile” approach used in most academic papers. We will continue to use value factors as key inputs into our models, because the evidence and our intuition tell us that positioning in securities characterized by lower expectations provides an edge for long term investors, even if the standalone factor trudges through long winters of underperformance.
Borrowing From Tech
If value investing is a bet that the future might not be as bad as prices suggest, venture capital investing is a bet that the future will be very bright. While we are not venture capitalists, we are fascinated with technology companies in general, and startups in particular. In our quest to deliver a better investing experience to our clients, we have and will continue to borrow heavily from the world of technology. Here are four examples that any asset or wealth manager could adopt.
Open Source
The fastest way to learn is to be (even slightly) wrong on the internet. At OSAM, we’ve talked a lot about the importance of sharing our work openly and quickly because we’ve seen the power of exposing ideas to a smart and critical audience.
Investment strategies on Wall Street have often been opaque. Strategies are often “proprietary” and lathered with “secret sauce.” And while some investors view complexity and opacity as good things, we believe that a more open, honest, research-centric approach will beat the proprietary model in the coming decades.
Even if you are transparent about your research and strategy, it is typically very hard for an outsider to replicate what you are doing. If you move with appropriate haste and keep improving, we believe that the incremental edge gained from sharing research is greater than protecting it as “proprietary.”
Of course, this isn’t for everyone. Many well-known firms with exemplary track records are black boxes. Even firms which are open in some regards—us included—have some secrets worth protecting. We aren’t going to share our code on GitHub. But we will share the concepts we are exploring to stress test them with the investment community. My guess is most firms would benefit from some version of open sharing. In the end, “open source” is just another way of saying “investor education,” and we love making that bet.
Data
If you told an analyst that they couldn’t use excel ever again, they’d have an existential crisis. Years from now, we will say the same thing about Python (and other similar tools). As Michael Recce, Neuberger Berman’s chief data scientist, said to me: “in excel, the data is visible and the formulas are hidden, in Python, the code is visible, and the data is hidden.” With insane amounts of new data coming on-stream, the ability to work with huge datasets will become increasingly important. This includes sourcing, scrubbing, and interpreting data—and the ability to ask good questions (i.e. form hypotheses).
One area of focus for venture investors and technology companies is artificial intelligence and machine learning. Metaphors always fall short, but Andrew Ng has a convenient one: “AI is the new electricity.” Based on Andrew’s observations in this phenomenal video and following this conversation with Ash Fontana, we believe that in the future, many “moats” will instead be called “loops.”
A loop is built by acquiring some preliminary data set, then using that dataset to build a product that is useful to customers, then using customer interactions with the product to get more data, which is then used to improve the product, which allows you to get more customers, and so on. A data edge can compound very quickly, so investment firms should be thinking about how they can build these advantages. We are doing this on the investing and business sides, in extremely simple ways like an investing research email list, and in more complicated ways like a portfolio diagnostic tool that we call “X-Ray.”
Machine learning technology (“ML”) can be intimidating, especially when the models become so complex that they become nearly impossible to interpret. But the various ML methods, with goofy sounding names like “random forests,” represent enormous levers if applied with caution and care. For those interested in learning a bit more, we recommend Machine Learning for Humans and A Visual Introduction to Machine Learning.
We’ve found that most of these methods produce subpar results for predicting stock price movements. Often a simple equally weighting of variables does better out of sample. You can’t just feed ML algorithms a bunch of data and future returns and expect to produce a magic formula. But, the methods do appear very useful for other tasks: natural language processing, classification, and some forms of prediction, to name a few. The transformation of share repurchase authorizations from an unstructured mess on 8-Ks to structured data would have been a major pain years ago. Now it is relatively simple, and potentially useful.
To be very clear: these tools are not a panacea. Most of their immediate applications are quite mundane, allowing you to accomplish tasks as if you had a million interns. They are points of leverage for pre-existing intuition and understanding: allowing the user to do a better job of what they are already doing. Today, ML isn’t integral to what we do. But, just as you wouldn’t function without tools like email, Excel, and now maybe Slack, we believe it a wise investment—personally and professionally—to build out expertise in the next generation of technology tools as soon as possible.
Platforms
Perhaps the most impactful lesson we’ve learned from the tech world is the power of platforms. Facebook, Google, Uber, Airbnb, and GitHub are all great examples of platforms.
Of particular interest to us is the marketplace model, where a company recruits “producers” and “consumers” on two sides of a market. To better understand how this model worked, I personally invested in a company called Ladder, which brings more affordable fitness coaching (and hopefully other health and wellness coaching) to everyone. The producers are coaches, and the consumers are the rest of us who want help.
The platform is the technology that sits between them: making coaches lives much easier with tons of tools for managing their businesses and workflow, and making consumers lives better by carefully tracking what they do and building accountability with their coach (there is a loop lurking here, too, where the data being collected can fuel algorithms that can help clients tailor workouts for specific goals, and maybe even project when those goals will be attained in a way that would be totally impossible for a trainer in a gym).
I made this investment to learn best practices. I learned the importance of making life easy for producers—who, in our case, are researchers and other team members. The platform is a “research platform,” consisting of a comprehensive, deep, and very clean dataset on global equities, software, technology, and programming capabilities. The consumers are our investors and other interested parties who follow what we do.
A key feature of most platform companies is that many of the producers don’t work for the LLC full time or at all. You as a Facebook user are both producer AND consumer. Because our research platform has grown so powerful, we set up the OSAM research partners program to take this idea to the next level. We will likely experiment with ways of getting more people involved very soon, to build out as big of an ecosystem as we can.
***
It is a fun exercise to consider: what would it mean in your business if you open sourced some part of your work, began gathering unique data sets, and built a platform of your own? We’ve found each to be a powerful (and affordable) boost and will continue to find more ways to deploy these ideas. bottom line: watch venture capitalists and technology startups, and borrow liberally from them.
Research Agenda
We typically have a small list of major, structured research projects and several other small ideas that we are working on. The small ideas often graduate to the structured category—it’s the perfect farm system. Here are three major projects currently underway. We will share our final findings and decisions with our investors upon completion.
"Event Calendar"
While it would be fair to call us factor investors, we think that is too simple a label. We are not providing exposure to generic factors like “value.” Instead we are trying to find the most useful signals for buying and selling equities and combining those signals into strategies that deliver significant alpha over time.
Financial statement and pricing data has long been the bedrock of quant research, but tracking other events at companies may also yield interesting results. We are in the process of mapping a generic calendar of potential events for each company and investigating whether certain types of developments (many reported via 8-Ks, for example) signal future results.
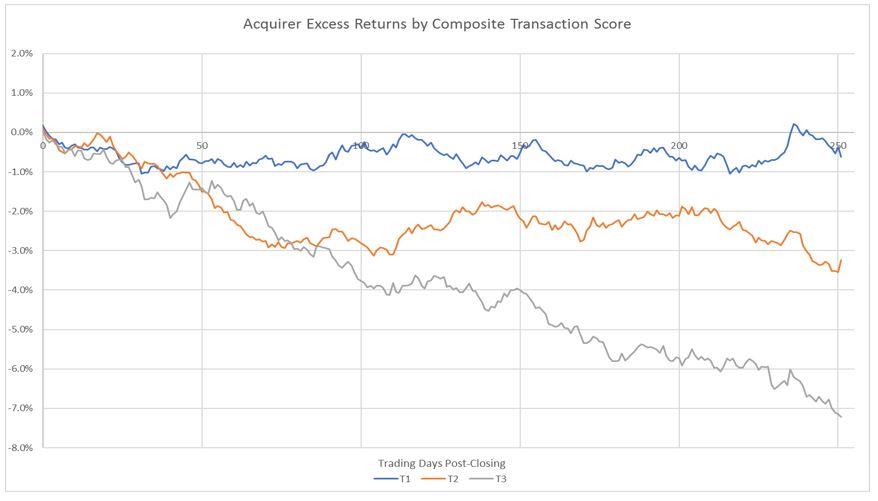
M&A activity is a good example of an event study. We’ve long had rules in place to sell any acquisition targets held in the portfolio when certain conditions are met (we are not merger arbitrageurs and are satisfied with a sufficiently full price). But what about the companies doing the acquiring? Focusing on factors like financing (equity + debt issuance as fraction of the deal value), payment type (stock, cash, combination), and price (premium paid for the target), we’ve found interesting preliminary results which show that perhaps certain types of acquisitions are more likely than others to lead to poor returns for the acquiring company.
If this signal were to make it into production in our models, it may only affect a few stocks across years of trading—but our goal is to add (or protect) return wherever possible. Similar studies are underway for other common events, like restatements. These could be deployed in the live model environment in a variety of ways, still to be determined.
Sector Junk
We are as sick of the term “quality” as everyone else. We prefer the term “junk” because it more accurately describes a better way to use so called “quality” factors.
Many factor studies focus on long/short portfolio returns: the spread between the highest-ranking stocks by a factor (decile, quintile) and the lowest-ranking. In general, factors which measure the health of a business (like balance sheet, earnings quality, profitability) show stronger results in the negative tail. This is distinct from selection factors like value or shareholder yield, which show a more monotonic pattern of excess return.
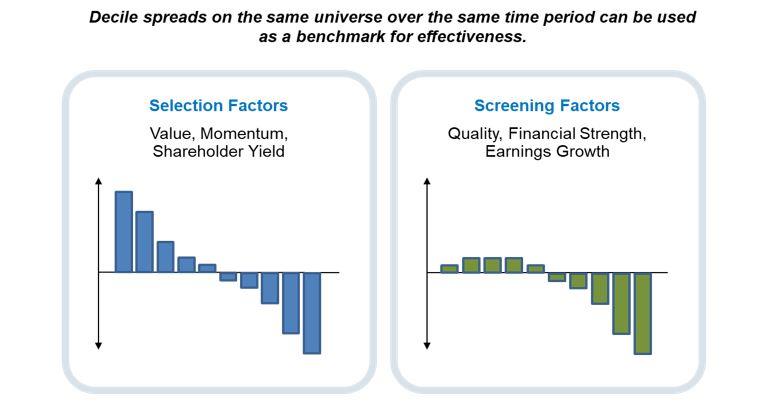
Put simply: avoiding junk is more useful than buying quality.
Some sectors and industries, like banks, have unique data which may help us better identify junk. While we’ve incorporated bank specific factors already in our U.S. models, we are continuing the charge to identify junk within sectors like REITs, international banks, and other industries to better weed out bad businesses from consideration in our model, no matter how strong they appear based on valuation, momentum, or shareholder yield.
We expect to deploy these findings on an ongoing basis.
Taxes and Turnover
Most quantitative equity research focuses on returns, but costs can be just as critical. Costs associated with turnover are the enemy. They come in the form of commissions, market impact (how much our trading is pushing stock prices), and taxes (if applicable). Over the years, we’ve worked very hard to reduce these costs as much as possible, and have an open project to further reduce them.
We are focused specifically on the rebalance frequencies and methodologies for our various strategies. Because we now have data and tools that allow us to estimate market impact costs historically (via ITG’s cost curve data), and allow us to model taxes to the cent, we have a better “after cost” testing method.
We will deploy this tool to see if we can improve our trading methodology to improve “all in” net returns for investors.
***
Our chassis will remain in place: disciplined selection and rebalancing based on fundamental signals like value, momentum, and shareholder yield. But each aspect of the process, be it signal measurement, rules for buying and selling, portfolio construction, or cost management, should improve through time.
For more on the mechanics of value (and momentum), we encourage you to check out Factors From Scratch, which is the first product of the OSAM research partners program, and our most widely read paper to date. This coming quarter look for more research on factors like low vol, quality, and shareholder yield, a summary of how to apply to machine learning, and costs charged by active managers. Have a great quarter.
Thank you for reading,

Patrick W. O’Shaughnessy,
Chief Executive Officer and Portfolio Manager
Footnotes
1 For a full description of this method, read Factors From Scratch
General Legal Disclosures & Hypothetical and/or Backtested Results Disclaimer
The material contained herein is intended as a general market commentary. Opinions expressed herein are solely those of O’Shaughnessy Asset Management, LLC and may differ from those of your broker or investment firm.
Please remember that past performance may not be indicative of future results. Different types of investments involve varying degrees of risk, and there can be no assurance that the future performance of any specific investment, investment strategy, or product (including the investments and/or investment strategies recommended or undertaken by O’Shaughnessy Asset Management, LLC), or any non-investment related content, made reference to directly or indirectly in this piece will be profitable, equal any corresponding indicated historical performance level(s), be suitable for your portfolio or individual situation, or prove successful. Due to various factors, including changing market conditions and/or applicable laws, the content may no longer be reflective of current opinions or positions. Moreover, you should not assume that any discussion or information contained in this piece serves as the receipt of, or as a substitute for, personalized investment advice from O’Shaughnessy Asset Management, LLC. Any individual account performance information reflects the reinvestment of dividends (to the extent applicable), and is net of applicable transaction fees, O’Shaughnessy Asset Management, LLC’s investment management fee (if debited directly from the account), and any other related account expenses. Account information has been compiled solely by O’Shaughnessy Asset Management, LLC, has not been independently verified, and does not reflect the impact of taxes on non-qualified accounts. In preparing this report, O’Shaughnessy Asset Management, LLC has relied upon information provided by the account custodian. Please defer to formal tax documents received from the account custodian for cost basis and tax reporting purposes. Please remember to contact O’Shaughnessy Asset Management, LLC, in writing, if there are any changes in your personal/financial situation or investment objectives for the purpose of reviewing/evaluating/revising our previous recommendations and/or services, or if you want to impose, add, or modify any reasonable restrictions to our investment advisory services. Please Note: Unless you advise, in writing, to the contrary, we will assume that there are no restrictions on our services, other than to manage the account in accordance with your designated investment objective. Please Also Note: Please compare this statement with account statements received from the account custodian. The account custodian does not verify the accuracy of the advisory fee calculation. Please advise us if you have not been receiving monthly statements from the account custodian. Historical performance results for investment indices and/or categories have been provided for general comparison purposes only, and generally do not reflect the deduction of transaction and/or custodial charges, the deduction of an investment management fee, nor the impact of taxes, the incurrence of which would have the effect of decreasing historical performance results. It should not be assumed that your account holdings correspond directly to any comparative indices. To the extent that a reader has any questions regarding the applicability of any specific issue discussed above to his/her individual situation, he/she is encouraged to consult with the professional advisor of his/her choosing. O’Shaughnessy Asset Management, LLC is neither a law firm nor a certified public accounting firm and no portion of the newsletter content should be construed as legal or accounting advice. A copy of the O’Shaughnessy Asset Management, LLC’s current written disclosure statement discussing our advisory services and fees is available upon request.
Hypothetical performance results shown on the preceding pages are backtested and do not represent the performance of any account managed by OSAM, but were achieved by means of the retroactive application of each of the previously referenced models, certain aspects of which may have been designed with the benefit of hindsight.
The hypothetical backtested performance does not represent the results of actual trading using client assets nor decision-making during the period and does not and is not intended to indicate the past performance or future performance of any account or investment strategy managed by OSAM. If actual accounts had been managed throughout the period, ongoing research might have resulted in changes to the strategy which might have altered returns. The performance of any account or investment strategy managed by OSAM will differ from the hypothetical backtested performance results for each factor shown herein for a number of reasons, including without limitation the following:
▪ Although OSAM may consider from time to time one or more of the factors noted herein in managing any account, it may not consider all or any of such factors. OSAM may (and will) from time to time consider factors in addition to those noted herein in managing any account.
▪ OSAM may rebalance an account more frequently or less frequently than annually and at times other than presented herein.
▪ OSAM may from time to time manage an account by using non-quantitative, subjective investment management methodologies in conjunction with the application of factors.
▪ The hypothetical backtested performance results assume full investment, whereas an account managed by OSAM may have a positive cash position upon rebalance. Had the hypothetical backtested performance results included a positive cash position, the results would have been different and generally would have been lower.
▪ The hypothetical backtested performance results for each factor do not reflect any transaction costs of buying and selling securities, investment management fees (including without limitation management fees and performance fees), custody and other costs, or taxes – all of which would be incurred by an investor in any account managed by OSAM. If such costs and fees were reflected, the hypothetical backtested performance results would be lower.
▪ The hypothetical performance does not reflect the reinvestment of dividends and distributions therefrom, interest, capital gains and withholding taxes.
▪ Accounts managed by OSAM are subject to additions and redemptions of assets under management, which may positively or negatively affect performance depending generally upon the timing of such events in relation to the market’s direction.
▪ Simulated returns may be dependent on the market and economic conditions that existed during the period. Future market or economic conditions can adversely affect the returns.
Composite Performance Summary
For the full composite performance summaries, please follow this link: http://www.osam.com