O’Shaughnessy Quarterly Investor Letter Q3 2019
By Patrick O’ShaughnessyOctober 2019
Dear Investor,
Between ongoing research projects and our rollout of the new Canvas platform, we’ve had a very busy quarter at OSAM. In this letter I’ll begin by highlighting the most interesting trend we see inside equity markets today, and finish by sharing the five key lessons that we’ve learned so far after demoing Canvas for more than 100 advisors and other capital allocators.
Valuations
The spread between cheap and expensive stocks is at its widest point in two decades, private equity multiples are now often higher than public market equivalents, and after direct scrutiny from public investors, once storied private companies like WeWork are being aggressively revalued.
I’ll dig into the most interesting angles below, but the summary is that cheap public companies—a category that has done very poorly since the financial crisis—appear as attractive relative to the market as they have since 2000. Public value stocks are cheap and getting cheaper relative to growth, all while capital floods venture capital and private equity firms.
Pricing inside the market
Not much has changed about the overall market’s valuation since our last check in. The U.S. market remains expensive relative to its modern averages on measures like P/E, Shiller CAPE, or our own Price/Integrated Equity ratio, built by our research partner“ Jesse Livermore+.”
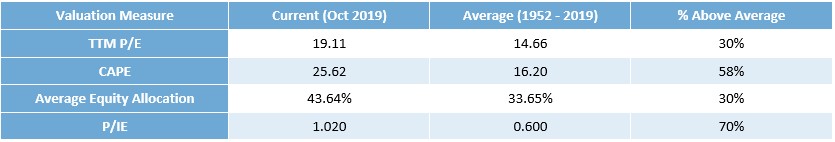
The P/IE ratio continues to suggest forward 10-year equity returns in the range of 4% annually—well below long term norms.
Valuation Spreads
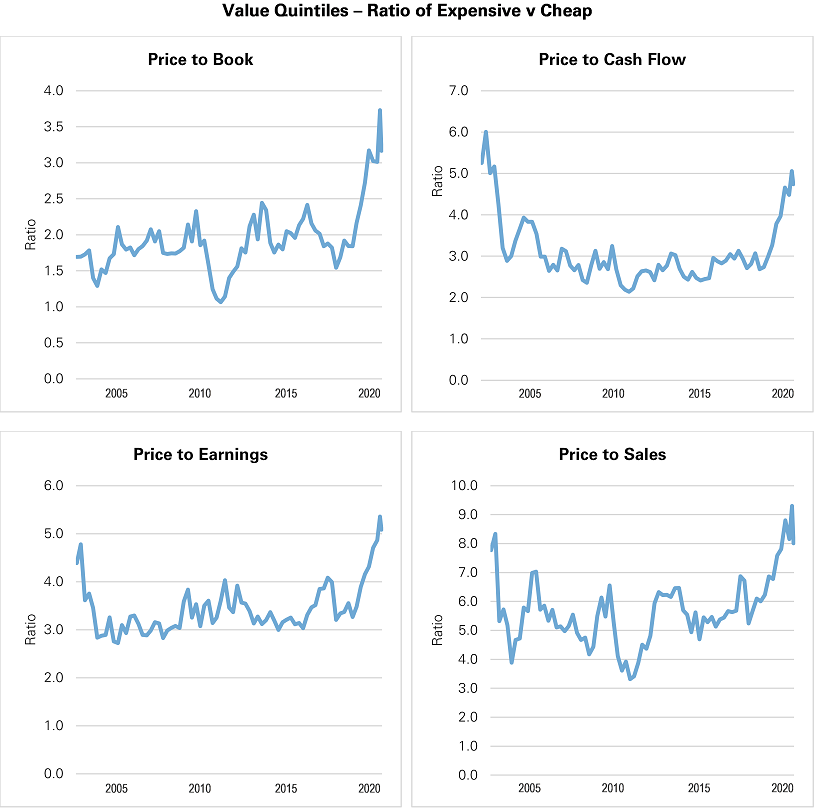
What is more interesting is what’s happening under the hood. These four charts show the spread between growth and value multiples (defined as the multiple for the cheapest quintile of stocks divided by the multiple for the most expensive quintile).
A higher number means that growth is relatively more expensive than value. For example, the price to book of growth stocks is roughly 3x higher than for value stocks (you can see this broken out in figure 2, which shows that expensive stocks trade at ~6x book, whereas cheap stocks trade at ~2x).
Across all metrics, growth stocks now trade at significant premiums to value stocks. The spreads are as high as we’ve seen since the dotcom boom, and they’ve widened significantly in the most recent period.
If you break these spreads into their growth and value parts, you see the obvious reason why this is happening: growth stocks are getting more expensive on an absolute basis, while value stocks have held steady or trended cheaper. This holds true regardless of which valuation measure you pick:
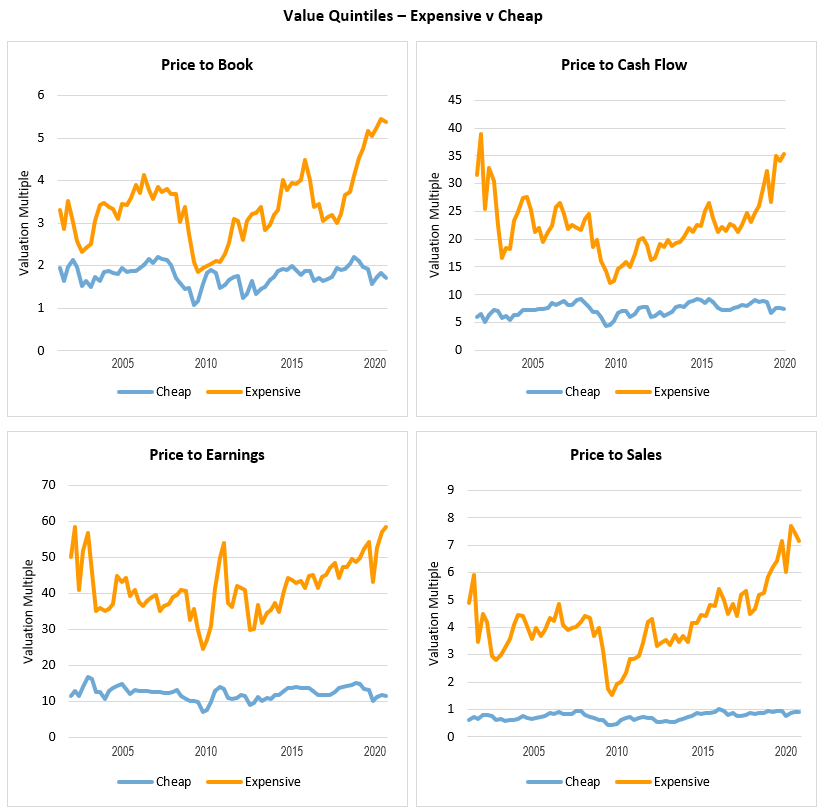
Zooming in on the 2015-present period, you can see a clear divergence in 2018 that has continued since through the third quarter of 2019.
Value Quintiles – Expensive v Cheap

During this period, value has done very poorly as a factor:
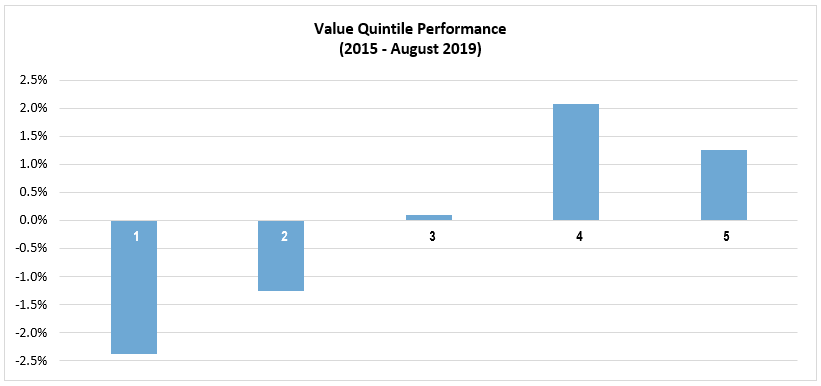
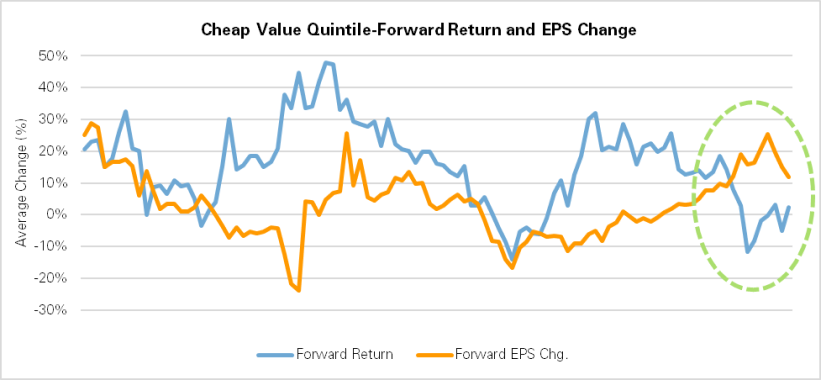
Yet this is all happening against a backdrop of improving earnings growth for the cheapest stocks. This chart shows the forward 1-year earnings growth for the cheapest quintile alongside the forward returns for the same stocks. In the most recent year, EPS growth has improved a lot, but returns have not.
Small Cap
The trends look similar among small cap stocks, where available valuations are even more extreme. To use an example, our small cap value strategy trades at 11.7x trailing twelve-month earnings. This space continues to intrigue us because quality and momentum factors work so well alongside value.
We continue to believe that quality screens are essential for value and momentum strategies, especially in small cap, where so many companies lose money (i.e. have negative earnings).
There has been a common narrative that the low cost of capital (low rates) has pushed lots of money further out on the risk spectrum, making it easier for early stage companies to grow without positive cash flow (think Uber, WeWork) and for smaller public companies to survive even without earnings.
What is alarming is that while in the past cycle (2000-2008), the percent of small cap companies with negative earnings steadily declined, in this cycle (2009-present), the percentage has gone up. As you can see below, more than 30% of small cap companies have negative earnings, 10 years into a bull market.

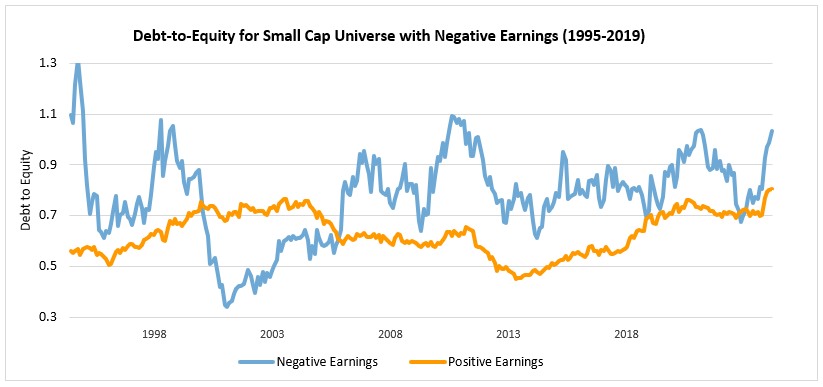
Perhaps because of the availability of capital, these negative earnings companies are also operating with more leverage than small companies that have positive earnings.
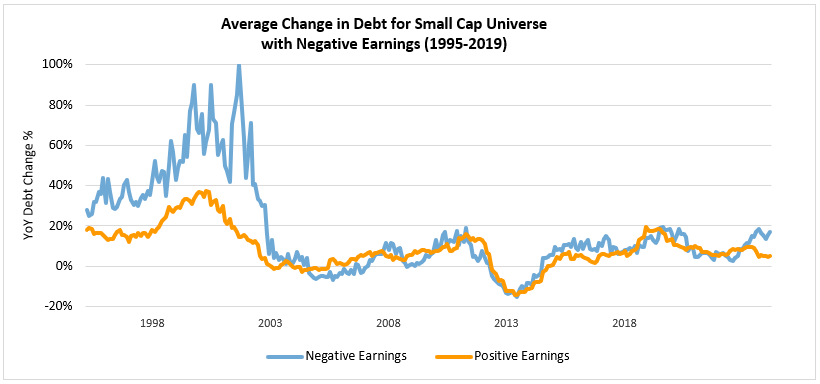
Meanwhile, even with more leverage, these companies are also growing their leverage at a similar rate:
Looking Forward
The rapid stretching of growth multiples in large cap, and the breadth of highly-levered, money-losing companies in small cap stand out as dominant themes in this market. As always, we are positioning our investors against these trends by focusing on valuation, quality, momentum, and shareholder yield.
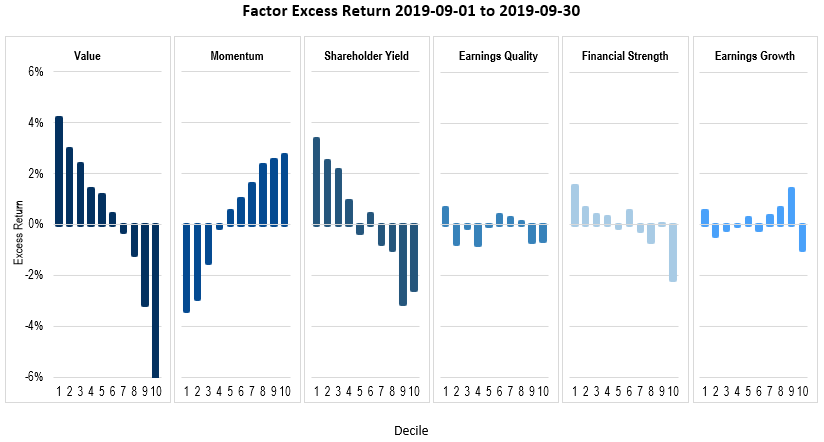
When factors reverse course, it can happen fast. I’ll close this section with the decile returns of our major factors during the month of September. Momentum had a sharp inversion while value and shareholder yield performed extremely well. If these trends are more than a quick blip on the radar, the data presented in this first section suggest that value may have a long way to run.
Early Canvas Lessons
One month ago, we revealed Canvas. Canvas is the first investing software platform that allows allocators to design and implement deeply customized investment strategies for their clients. We are still working our way through demo requests, but we’ve done enough to learn some valuable lessons about Canvas. Here are the five biggest such lessons:
I. Two Layers of Customization
We’ve realized that there are two practical types of customization in Canvas: adviser and client.
The first type of customization happens at the adviser firm level. In the case of each new firm, we have been taking that firm’s existing investment philosophy and building it into the Canvas platform. We do so by mapping existing strategies onto custom templates. I’ve been pleasantly surprised by how varied these are, and it is very fun to be able to rebuild a firm’s philosophy from scratch with software, often making improvement along the way (via better factor exposures, etc.).
The second type of customization happens at the individual client level. Once the firm’s templates are established, we spend most of our time building strategies with specific clients in mind. This means adjusting for tax circumstances, concentrated stock exposures (to manage risk and taxes), and preferences (ESG, SRI, etc.). This is the area where we’ve learned the most in the first month.
II. The Roadmap is as Important as the Destination
When you combine the two layers of customization, you are left with carefully designed, client specific investment strategies—each of which is a destination of sorts for the investor in question.
But as important as the destination is, so is the roadmap for transitioning from what the client owns today to what they will own once fully invested in their Canvas strategy.
The biggest obstacle to overcome is embedded taxable gains. The single feature of Canvas that we’ve talked about the most with advisers is tax transition. Tax loss harvesting is an amazing tool for managing these transitions, and thanks to back and forth with early partners, we now have the visuals to show the roadmap in action. It feels like we’ve built almost as much functionality in this area as we did for the original Canvas investing software itself. If you’d like to hear more about how the tax transition works, let us know.
III. Handling Single Stock Exposures
The most interesting of these embedded taxable gains are large single stock exposures. In the past, there have not been great solutions for reducing these positions without large related tax bills. Now, we can more effectively transition away from single stocks with a low-cost basis. Because everything is systematic, we can manage the glidepath as efficiently as possible with input from each client on how to balance cost (taxes) vs. speed (time to reduce large risk exposure).
We never appreciated how big and common a problem this was until we began giving Canvas demos.
IV. The Design of Software and Reporting
Most people respond strongly to the design of Canvas user interface. I believe this will be more and more important because everyone has become used to easy and intuitive software experiences. Investing will be no different. One of my favorite outcomes so far is that some advisers are showing Canvas to their clients directly.
The interface also elicits a common question: “can it also do [fill in the blank]?” We love this question, because it’s like a cheat code for understanding what the most pressing problems advisers and their clients are dealing with today.
We’ve learned that responsive software—with its dials and inputs—is a very effective way to communicate information. Data visualization and communication will remain a key focus area for the OSAM team.
V. Focus on the First Ten
If I had to sum up the first four lessons, it would be that Canvas has let us get to know adviser firms and their clients in a way that we never have before. The final lessons is that depth with our early partners is more important than breadth of partnerships. We’ve therefore decided to focus very carefully on identifying ~10 firms to work with on Canvas early on1.
It is our intention to stick with these early firms as partners, building and developing tools that are useful to them, for as long as it takes. I’ve made this commitment very clear to the OSAM team, to the “First Ten” firms that have signed on so far, and now, to everyone reading this.
This allows us to approach each new inquiry and unique investing situation with a ton of care. As specific types of inquiries repeat, we will begin to automate and build these functions into software. By focusing in this way, we can make Canvas fit each of the First Ten firms—and each of their clients—like a glove.
***
We’ve just begun our next research and development cycle, so I will be back at the end of the year with more updates on both our latest quantitative research and technology updates.
Have a great Fall!

Patrick W. O’Shaughnessy, CFA
Chief Executive Officer and Portfolio Manager
Footnotes
1 Thanks in large part to a fascinating conversation with Chetan Puttagunta of Benchmark Capital (who specializes in enterprise software). As Chetan said to me, the best lifetime customer value is infinity, and the best cost to acquire a customer is zero. There’s only one way to approach those aspirational numbers…complete focus on customer value and experience. As we discuss in a podcast to be shared soon, this means taking more time and care with early customers than might even seem natural.
Finally, here are the research papers published during the past quarter:
ESG the Right Way: Customization and Not Scale
Machine Learning & Investing Part 2: Clustering
Shareholder Yield: A Differentiated Approach to an “Efficient” Market – US Large Cap Value
Value is Dead, Long Live Value
The Earnings Mirage” Why Earnings are Overstated and What It Means for Investors (full paper) & The Earnings Mirage (executive summary)
GENERAL LEGAL DISCLOSURES & HYPOTHETICAL AND/OR BACKTESTED RESULTS DISCLAIMER