A Generational Opportunity
By Jim O’ShaughnessyMarch 2009
“THE CHINESE USE TWO BRUSH STROKES TO WRITE THE WORD ‘CRISIS.’ ONE BRUSH STROKE STANDS FOR DANGER; THE OTHER FOR OPPORTUNITY. IN A CRISIS, BE AWARE OF THE DANGER — BUT RECOGNIZE THE OPPORTUNITY.”
JOHN F. KENNEDY
I recently had dinner with a client who told me that stocks had not performed well over the last 40 years. At first I suspected that she was generalizing from the recent pummeling equity markets have experienced—after all, this is a time frame that included two of the biggest bull markets in history! Yet, when I went to the data, I found out that she was absolutely right. The 40 years ending February 2009 were the second worst 40-year period for equities since 1900, with only the 40 years ending December 1941 doing worse!
Let’s put this into perspective. The 40 years ending in 1941 included the stock market panic of 1907, which drove down the Dow Jones Industrial Average nearly 38 percent; the World War I Era, where the period between 1910 and 1919 was one of the worst ever for stocks; AND, oh yes, the Great Depression. Finally, icing on the 40-year cake, the Japanese bombed Pearl Harbor on December 7, 1941. How could these last 40 years even begin to match that? Alas, they did.
The chart below is a histogram of the average annual real returns for U.S. equities (large stocks) for all 40-year holding periods, with annual data starting in 1900 and monthly data beginning in 1926. There were only three 40-year periods where U.S. stocks returned less than 4 percent annually—the 40 years ending December 1941, where they earned a real rate of return of 3.80 percent annually for the previous 40 years; the 40 years ending February 2009, where they earned 3.86 percent annually; and the 40 years ending December 1942, where stocks returned 3.92 percent per year. Keep in mind that’s just 0.55 percent of the 545 periods analyzed. We are talking about an event so rare, that most of us alive today will never see such an opportunity again.
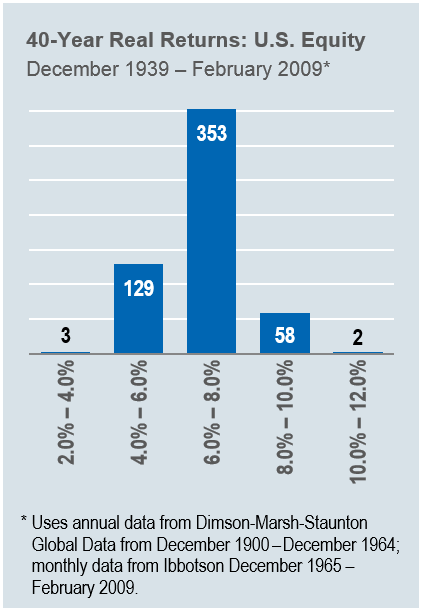
The histogram also shows the norm—stocks returned between 6 and 8 per-cent per year for 353 periods, or nearly 65 percent of all of the 40-year periods analyzed. Looked at closely, you see that 99.45 percent of all observed 40-year periods, U.S. stocks enjoyed a real rate of return between 4 and 12 percent per year, and that we are now presented with a huge generational opportunity.
Reversion to the Mean: Short, Medium and Long Term
Like I did in my last commentary, let’s look at what happened with U.S. stocks the first time they earned less than 4 percent per year for a 40-year period. For the five-, ten-, and twenty-year periods following the nadir reached in 1941, here are the real average annual compound returns for a variety of U.S. stock categories:

Where Do We Go From Here?
A combination of factors is responsible for the woes of the last 40 years, but one thing has been consistent. When we find ourselves at historic market lows, we are presented with rare opportunities. The world must have looked pretty bleak to investors at the end of 1941—in addition to all of the travails endured over the previous 40 years, the United States was entering yet another World War with no certainty of victory. Psychologically, it must have made our current circumstances look trivial in comparison.
Nevertheless, we see little current evidence that encourages us to invest in stocks. We are bombarded on a daily basis with terrifying news of the most recent collapse; a steadily declining stock market with prognosticators predicting more of the same, and if we try to educate ourselves by perusing recent business titles we see that the number one bestselling financial book on Amazon is “The Great Depression Ahead: How to Prosper in the Crash Following the Greatest Boom in History.” What’s more, most of our recent experiences with stocks have been negative. The ten years ending February 2009—where the market lost 5.79 percent per year—were the worst 10-year return for the S&P 500 since 1900, and the recent decline over the last six months was the swiftest for stocks since 1932.
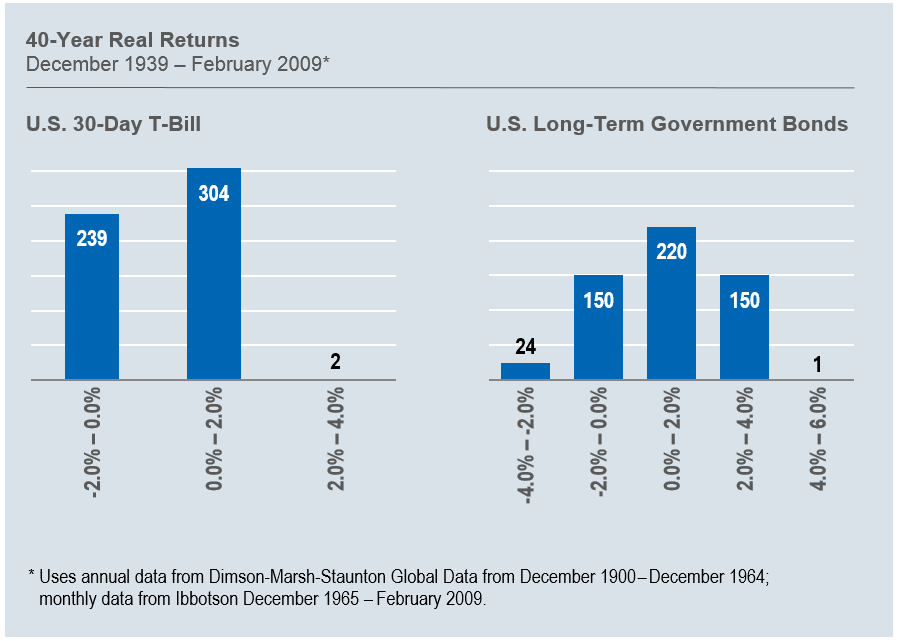
At times like these, the asset class that I believe will prove the least risky over the long-term appears to be the riskiest, and vice versa. T-bills have returned virtually nothing to investors over the long term, and currently yield virtually nothing because they are being priced by short-term fear. You can’t get a much better return from longer-term government paper—the current yield on the 10-year Treasury is 2.87 percent—and just 1.83 percent on the Treasury inflation-protected TIPS. The histograms below show the 40-year real rates of returns for T-bills and long-term government bonds. Note that, unlike stocks, both have had negative 40-year returns, and long-term government bonds returned losses in 32 percent of the 40-year periods. Indeed, at current yields I believe that Treasuries are the next bubble and that ten years from now, people will rue the day they fled the volatility of the stock market for the “safety” of government bills and bonds.
If an investor with $100,000 in a 401(k) invested equally in the stocks featured above by capitalization and style category and received returns similar to those after the last 40-year crater in the early 1940s, five years from now their portfolio would be worth $236,836 compared to just $109,491 if they invested in the 10-year TIPS bond. If the next five years are not nearly as good as those coming out of the 1940s and an equity investor simply earned the long-term average of 7 percent per year, their portfolio would still be worth $140,255 in five years time — significantly better than what they might earn with the TIPS.
Many will say that I got bullish too early, writing that stocks were a screaming buy in Fall 2008 and that they have only declined since then. That’s true. Yet major stock market bottoms are seldom defined by a single point in time. Stocks began presenting great opportunities in Fall 2008, and those opportunities have improved even more since then. Disciplined long-term investors learn to take advantage of these broad market valleys and continue putting money to work as long as the huge opportunity remains. I started putting additional cash in the market in late September, continuing to do so through late January, and I will continue to do so in the ensuing months if the market continues to decline. Every time I feel short-term pain, I review the long-term data that helps me focus on the stock market’s long-term potential.
Now is the time for all investors to do the same—for young investors, this is perhaps a once in a lifetime gift, and they should do their best to open and make maximum contributions to their 401(k)s and other tax-advantaged plans. For middle-aged investors like myself, I recommend increasing the equity allocation of your portfolio to 70 percent and consistently moving money into stocks over the coming months. And for investors who are already retired, now is the time to increase your allocation to stocks, particularly if you are significantly over-weight bonds. If you are 70 years old, the actuarial tables say you will live another 13 ½ years—and a robust port-folio will help you enjoy your remaining years more fully. I recommend working with your advisor to see what would be right for you, giving particular attention to blue chip stocks that are paying historically high dividends.
Like Warren Buffet, I believe that you will never make money betting against the United States over the long term. We have come through far greater challenges than the one we now face, stronger, more vibrant and ready to face the future. I believe that this time will be no different and that investors who take advantage of currently depressed stock prices will be delighted with the outcome five to ten years from now.
General Legal Disclosure/Disclaimer and Backtested Results
The material contained herein is intended as a general market commentary. Opinions expressed herein are solely those of O’Shaughnessy Asset Management, LLC and may differ from those of your broker or investment firm.
It should not be assumed that your account holdings correspond directly to any comparative indices. Individual accounts may experience greater dispersion than the composite level dispersion (which is an asset weighted standard deviation of the accounts in the composite for the full measurement period). This is due a variety of factors, including but not limited to, the fresh start investment approach that OSAM employs and the fact that each account has its own customized re-balance frequency. Over time, dispersion should stabilize and track more closely to the composite level dispersion. Gross of fee performance computations are reflected prior to OSAM’s investment advisory fee (as described in OSAM’s written disclosure statement), the application of which will have the effect of decreasing the composite performance results (for example: an advisory fee of 1% compounded over a 10 year period would reduce a 10% return to an 8.9% annual return). Portfolios are managed to a target weight of 3% cash. Account information has been compiled by OSAM derived from information provided by the portfolio account systems maintained by the account custodian(s), and has not been independently verified. In calculating historical asset class performance, OSAM has relied upon information provided by the account custodian or other sources which OSAM believes to be reliable. OSAM maintains information supporting the performance results in accordance with regulatory requirements. Please remember that different types of investments involve varying degrees of risk, that past performance is no guarantee of future results, and there can be no assurance that any specific investment or investment strategy (including the investments purchased and/or investment strategies devised and/or implemented by OSAM) will be either suitable or profitable for a prospective client’s portfolio. OSAM is a registered investment advisor with the SEC and a copy of our current written disclosure statement discussing our advisory services and fees continues to remain available for your review upon request.
Hypothetical performance results shown on the preceding pages are backtested and do not represent the performance of any account managed by OSAM, but were achieved by means of the retroactive application of each of the previously referenced models, certain aspects of which may have been designed with the benefit of hindsight.
The hypothetical backtested performance does not represent the results of actual trading using client assets nor decision-making during the period and does not and is not intended to indicate the past performance or future performance of any account or investment strategy managed by OSAM. If actual accounts had been managed throughout the period, ongoing research might have resulted in changes to the strategy which might have altered returns. The performance of any account or investment strategy managed by OSAM will differ from the hypothetical backtested performance results for each factor shown herein for a number of reasons, including without limitation the following:
- Although OSAM may consider from time to time one or more of the factors noted herein in managing any account, it may not consider all or any of such factors. OSAM may (and will) from time to time consider factors in addition to those noted herein in managing any account.
- OSAM may rebalance an account more frequently or less frequently than annually and at times other than presented herein.
- OSAM may from time to time manage an account by using non-quantitative, subjective investment management methodologies in conjunction with the application of factors.
- The hypothetical backtested performance results assume full investment, whereas an account managed by OSAM may have a positive cash position upon rebalance. Had the hypothetical backtested performance results included a positive cash position, the results would have been different and generally would have been lower.
- The hypothetical backtested performance results for each factor do not reflect any transaction costs of buying and selling securities, investment management fees (including without limitation management fees and performance fees), custody and other costs, or taxes – all of which would be incurred by an investor in any account managed by OSAM. If such costs and fees were reflected, the hypothetical backtested performance results would be lower.
- The hypothetical performance does not reflect the reinvestment of dividends and distributions therefrom, interest, capital gains and withholding taxes.
- Accounts managed by OSAM are subject to additions and redemptions of assets under management, which may positively or negatively affect performance depending generally upon the timing of such events in relation to the market’s direction.
- Simulated returns may be dependent on the market and economic conditions that existed during the period. Future market or economic conditions can adversely affect the returns.