Q4 2020 Factor Performance Comments
By OSAM Research TeamJanuary 2021
Key Points:
- Our key selection factors of Shareholder Yield, Momentum, and Value were largely consistent across universes for the quarter. Value and Shareholder Yield outperformed in all universes, while Momentum underperformed. For the year, Value and Shareholder Yield underperformed in all universes and Momentum only outperformed outside the U.S.
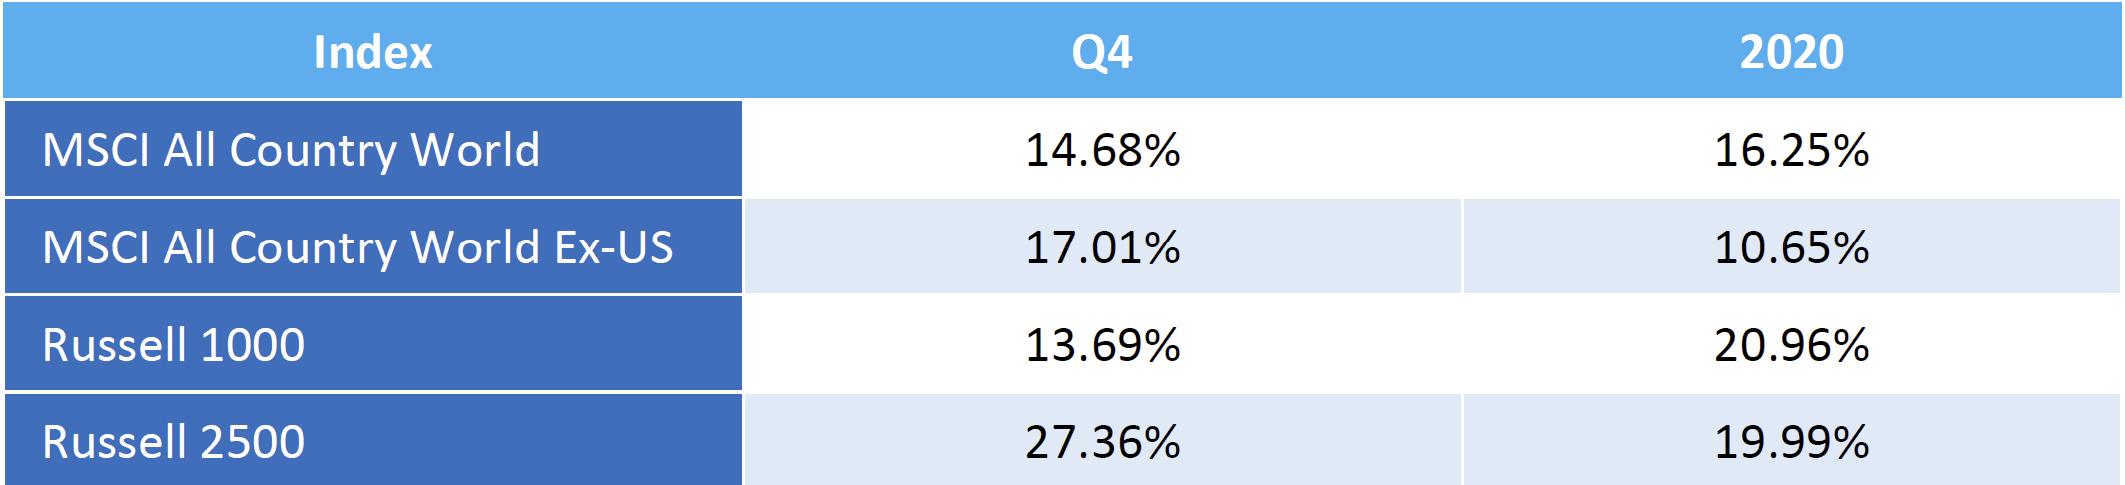
- Lower market cap stocks outperformed on the quarter and year across universes, which was a tailwind for factor allocations relative to cap-weighted indexes.
- Poor quality stocks that do not meet our criteria for Value, Momentum, Earnings Quality, Earnings Growth, and Financial Strength are excluded from factor allocations and were a detractor from returns as low-quality companies outperformed.
The fourth quarter marked the third consecutive positive quarter for equity markets since the COVID-crisis began. As has been the case the entire year, it was riddled with geopolitical landmines like Brexit, the COVID pandemic, and an added kicker from the U.S. political process. On the factor front, 2020 was a strange year that had four regimes:
- Jan 1 - Feb 19: Pre-COVID mega cap growth rally that was a continuation from 4Q19.
- Feb 20 - Mar 23: COVID-induced swift drawdown which caught many value investors by surprise with the style's underperformance. Value was cyclically oriented heading into the event, making it particularly susceptible.
- Mar 24 - Sep 2: Mega cap growth-led work from home recovery that emphasized a handful of Tech, Health Care, and speculative stocks.
- Sep 3 - Dec 31: The Reflation Rally got going after a 10% pullback in early September and accelerated in November with the U.S. election and multiple vaccine announcements.
U.S. Large Stocks
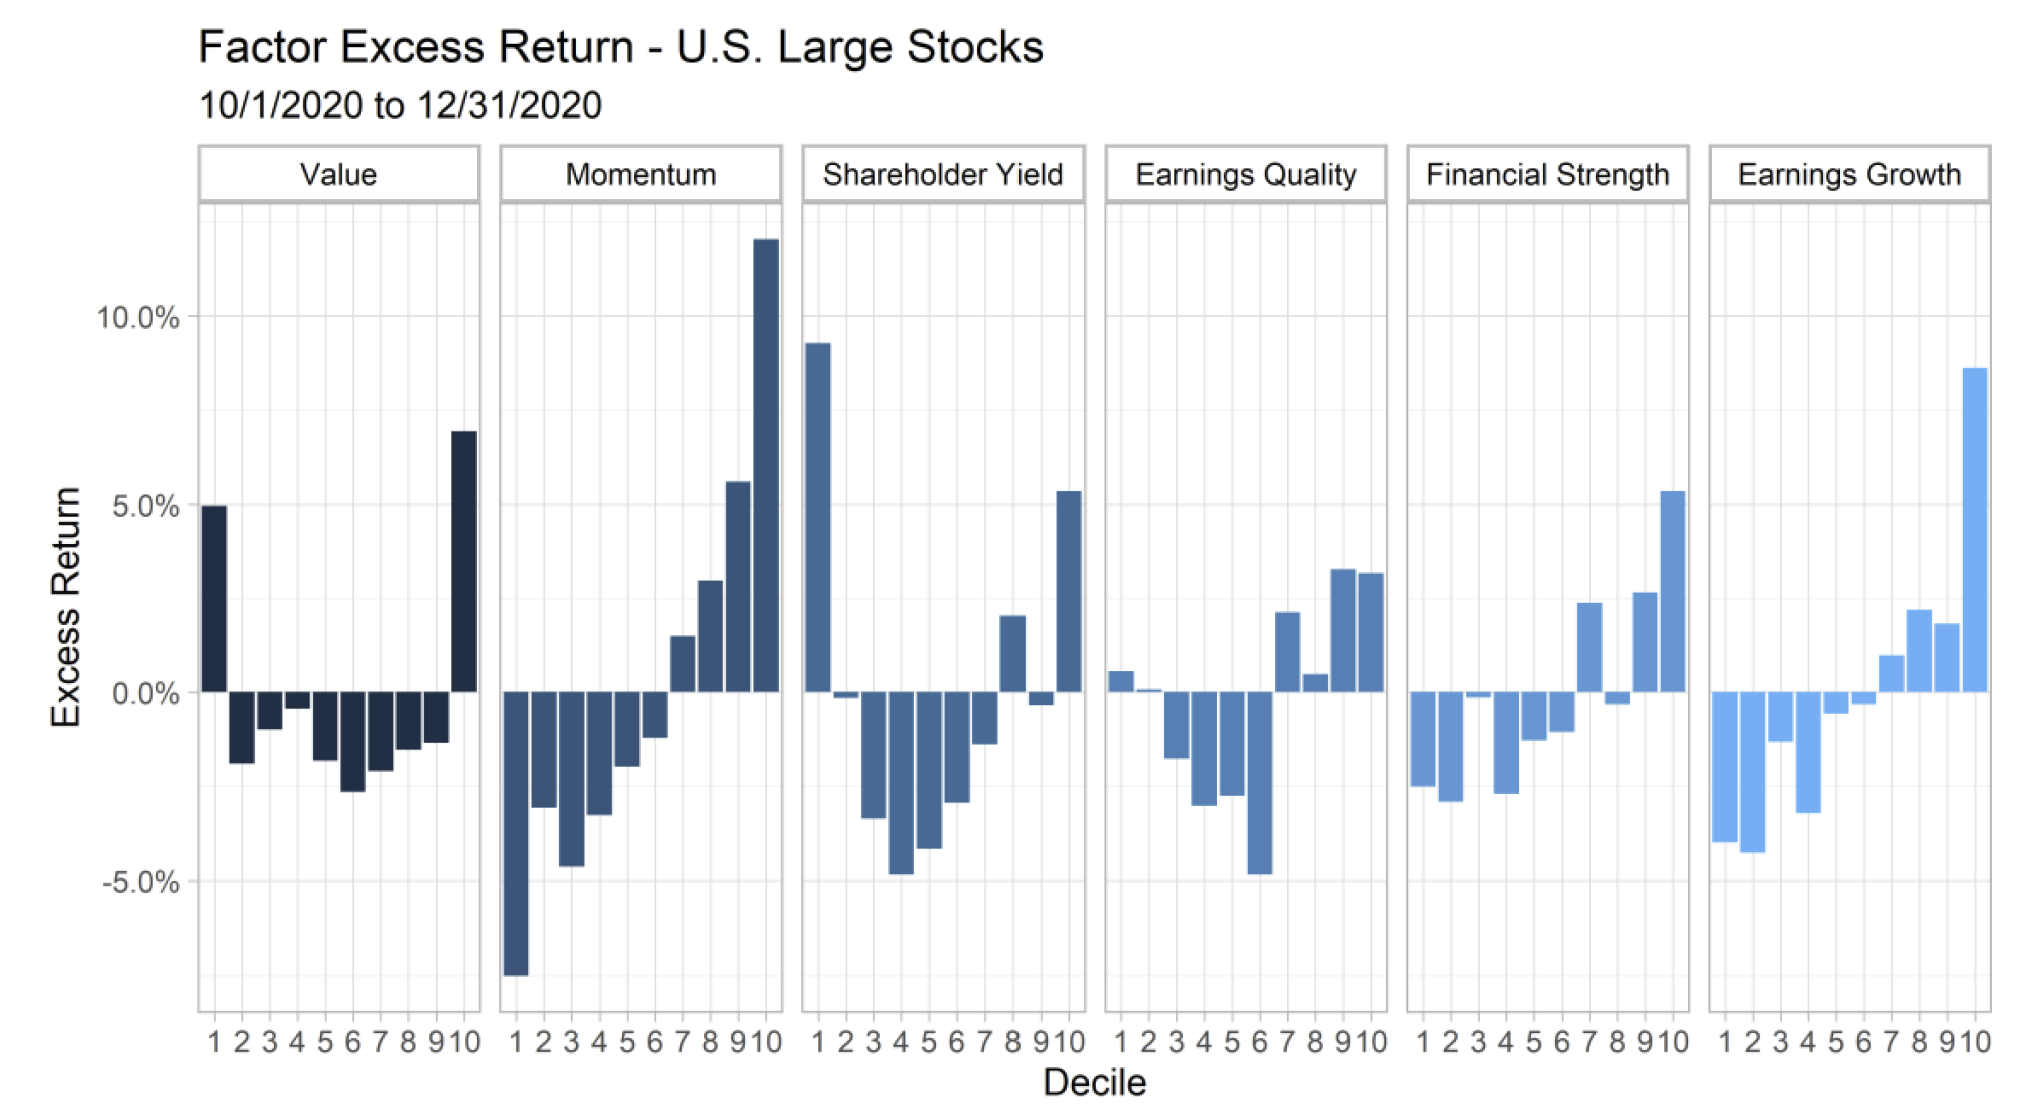
The fourth quarter fell into the reflation rally and continued to frustrate Value investors as cheapness was rewarded, but not linearly. The chart above shows factor performance within our U.S. Large Stocks universe across the six key stock selection themes we monitor. Moving from left to right—Value exhibited a strange U-shaped distribution with both cheap (decile 1) and expensive (decile 10) outperforming. Momentum inverted. Shareholder Yield, like Value, followed a strange distribution. For our quality themes, both the top and bottom deciles for Earnings Quality outperformed, while Financial Strength and Earnings Growth inverted on the quarter—meaning poor quality outperformed.
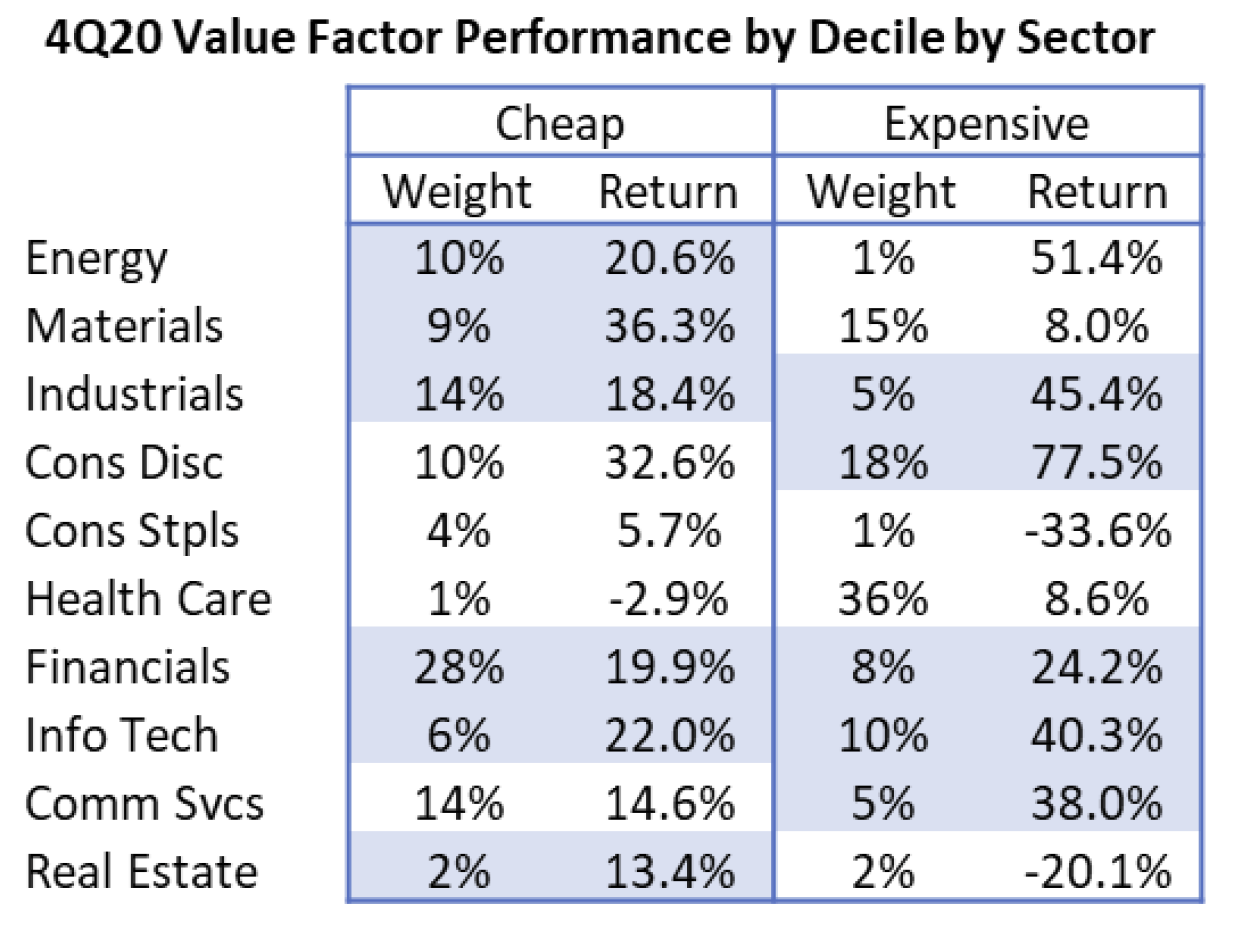
The U-shaped distribution characterizing Value's performance is strange. Often, when we see this type of disparate performance, underlying sector trends are the culprit. As we addressed in our 3Q commentary, cheap stocks came into the year loaded into Industrials, Financials, and other cyclicals, while expensive stocks were dominated by Tech and Health Care. That positioning was little changed in Q4, and ultimately, explains the strange U-shaped pattern. Below is a table showing the weight to each sector as of 9/30/2020 and the subsequent 4Q performance by sector within the cheap and expensive deciles of Value.
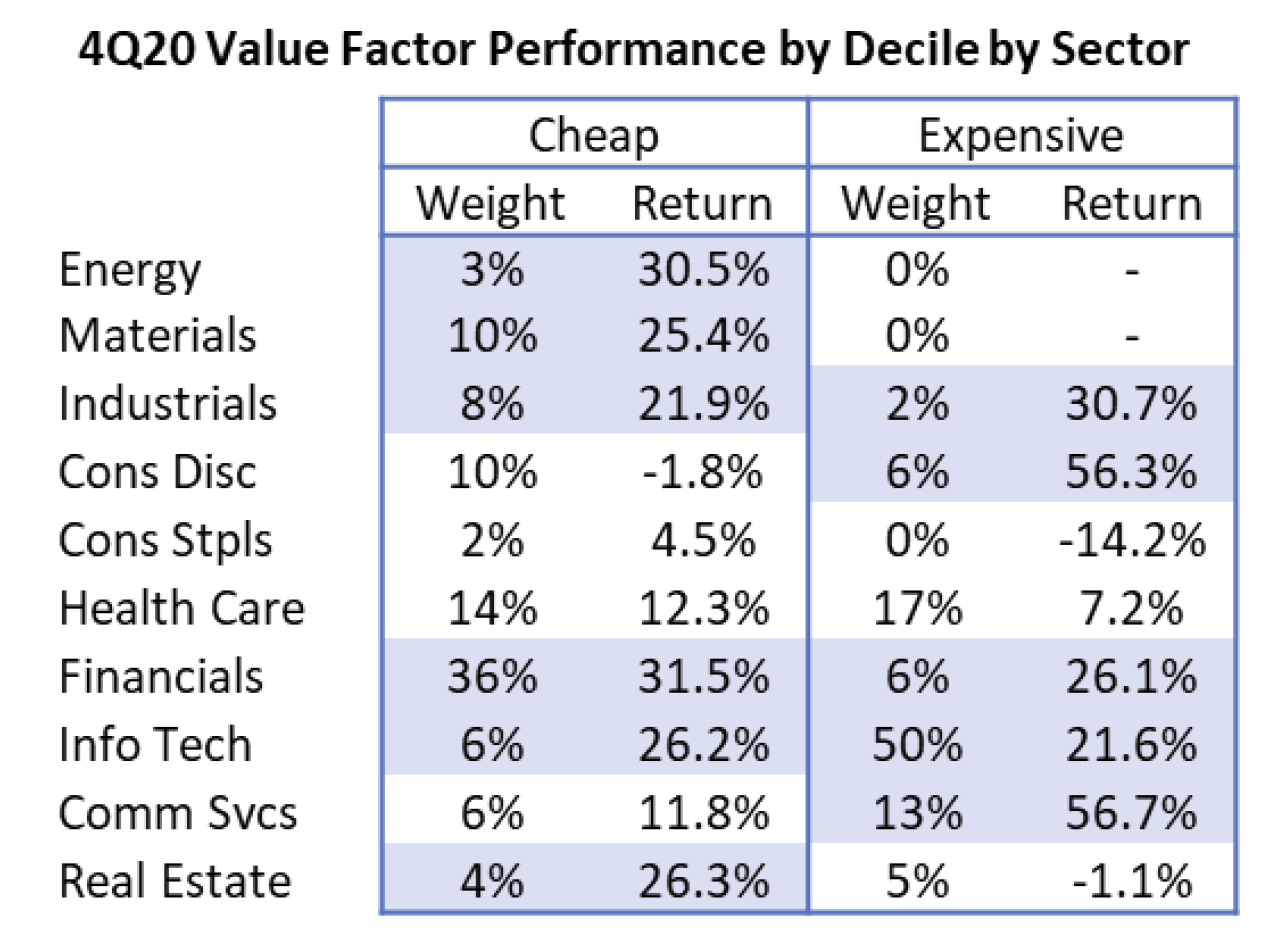
While cheap stocks derived their excess return from overweights to and selection within Financials, Energy, Materials, and Industrials, expensive stocks achieved their edge from Info Tech, Consumer Discretionary, and Communication Services. In other words, FANMAG stocks. Basically, you wanted to invest in either cheap stocks or expensive ones, but nothing in between.
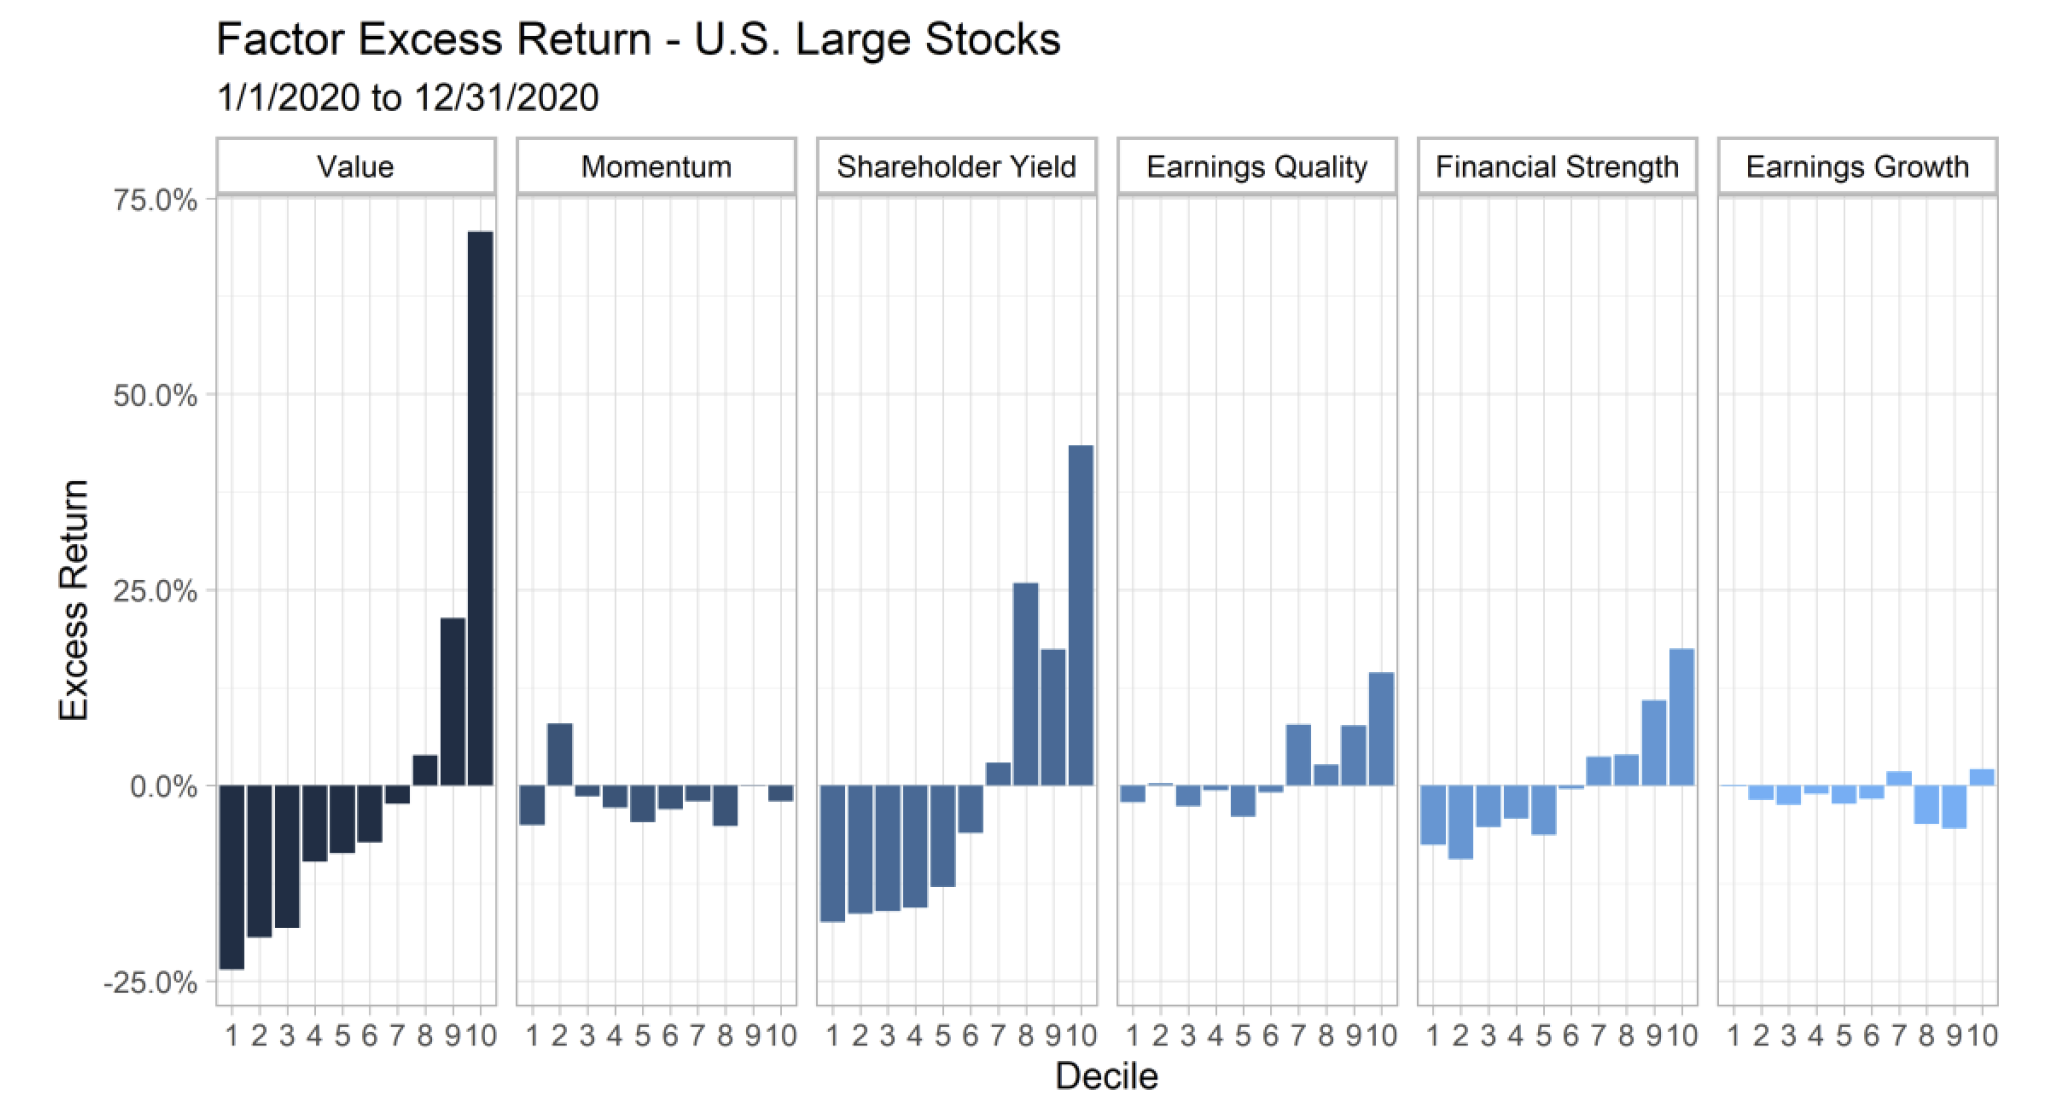
Factor performance on the year was another strange amalgamation of performance regimes. All told, the theme that was most outsized was the Value inversion. The spread in performance between cheap and expensive stocks on the year ended at 94%!
U.S. Small-Mid Stocks
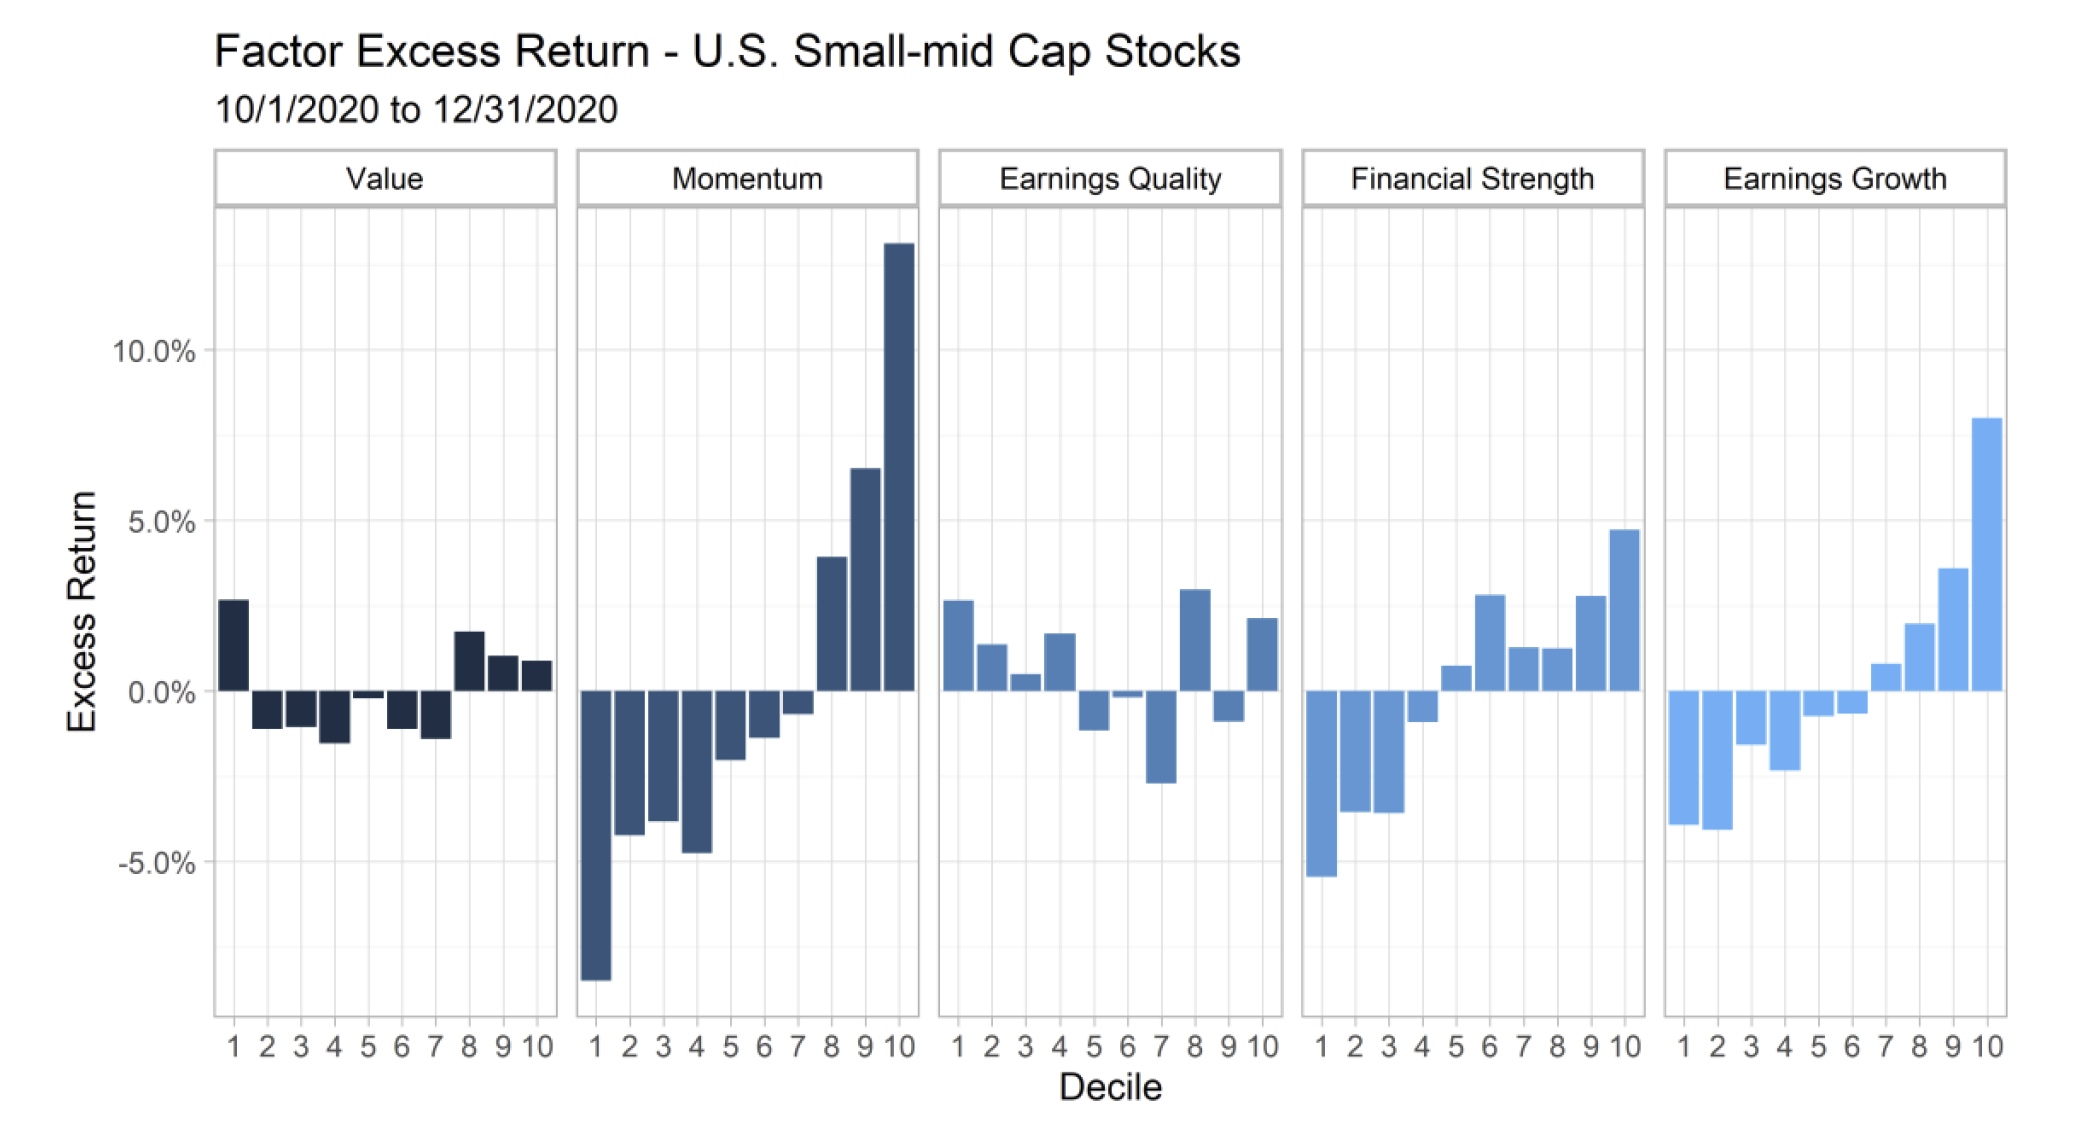
The chart above shows factor performance within our US Small-Mid Stocks universe across the six key stock selection themes we monitor. Moving from left to right—Value exhibited a similarly strange (but more muted) U-shaped distribution with both cheap (decile 1) and expensive (decile 10) outperforming. Momentum significantly inverted. For our quality themes, both the top and bottom deciles for Earnings Quality outperformed, while Financial Strength and Earnings Growth inverted on the quarter—meaning poor quality outperformed.
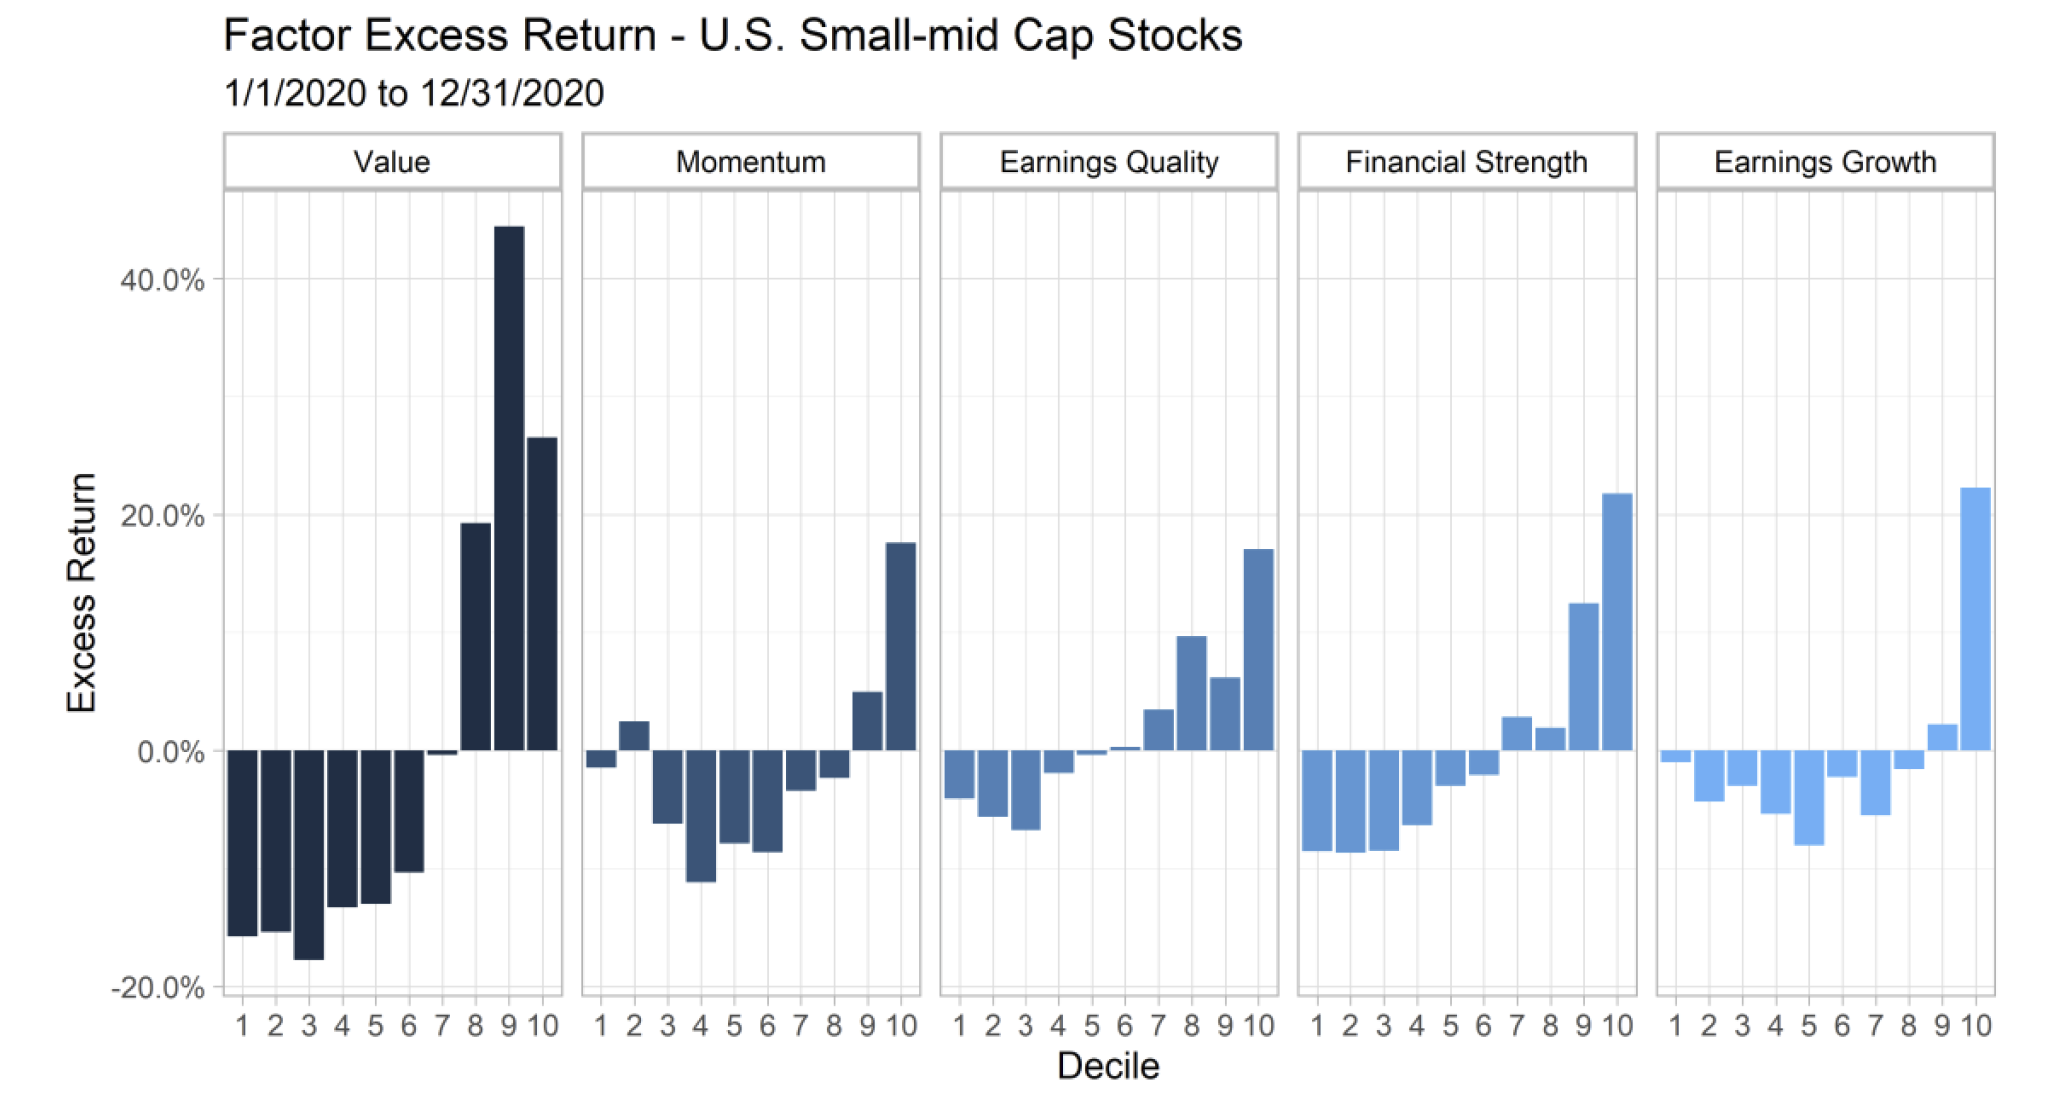
Factor performance on the year was more divergent, with a substantial inversion for Value. The spread in performance between cheap and expensive Small-mid stocks on the year ended at 42%.
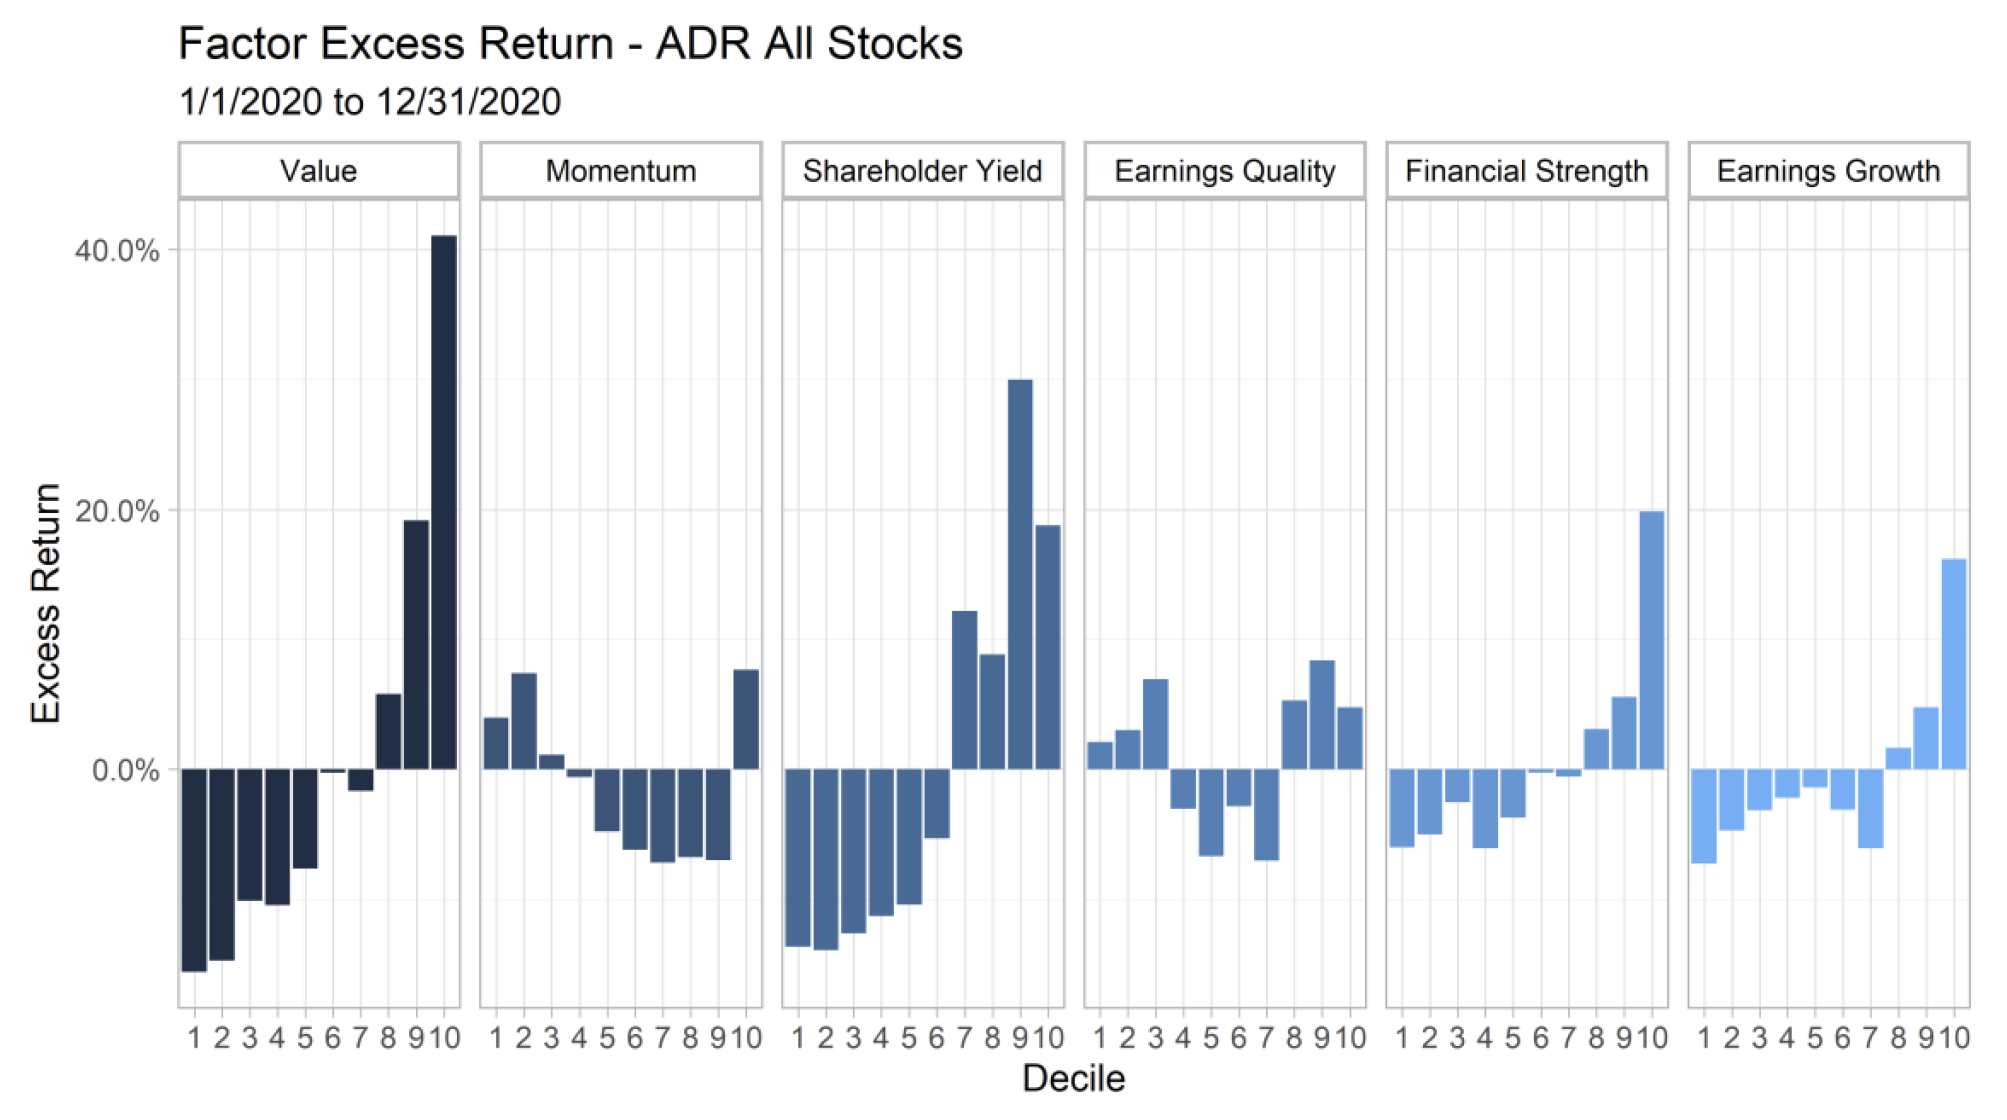
International ADR Stocks
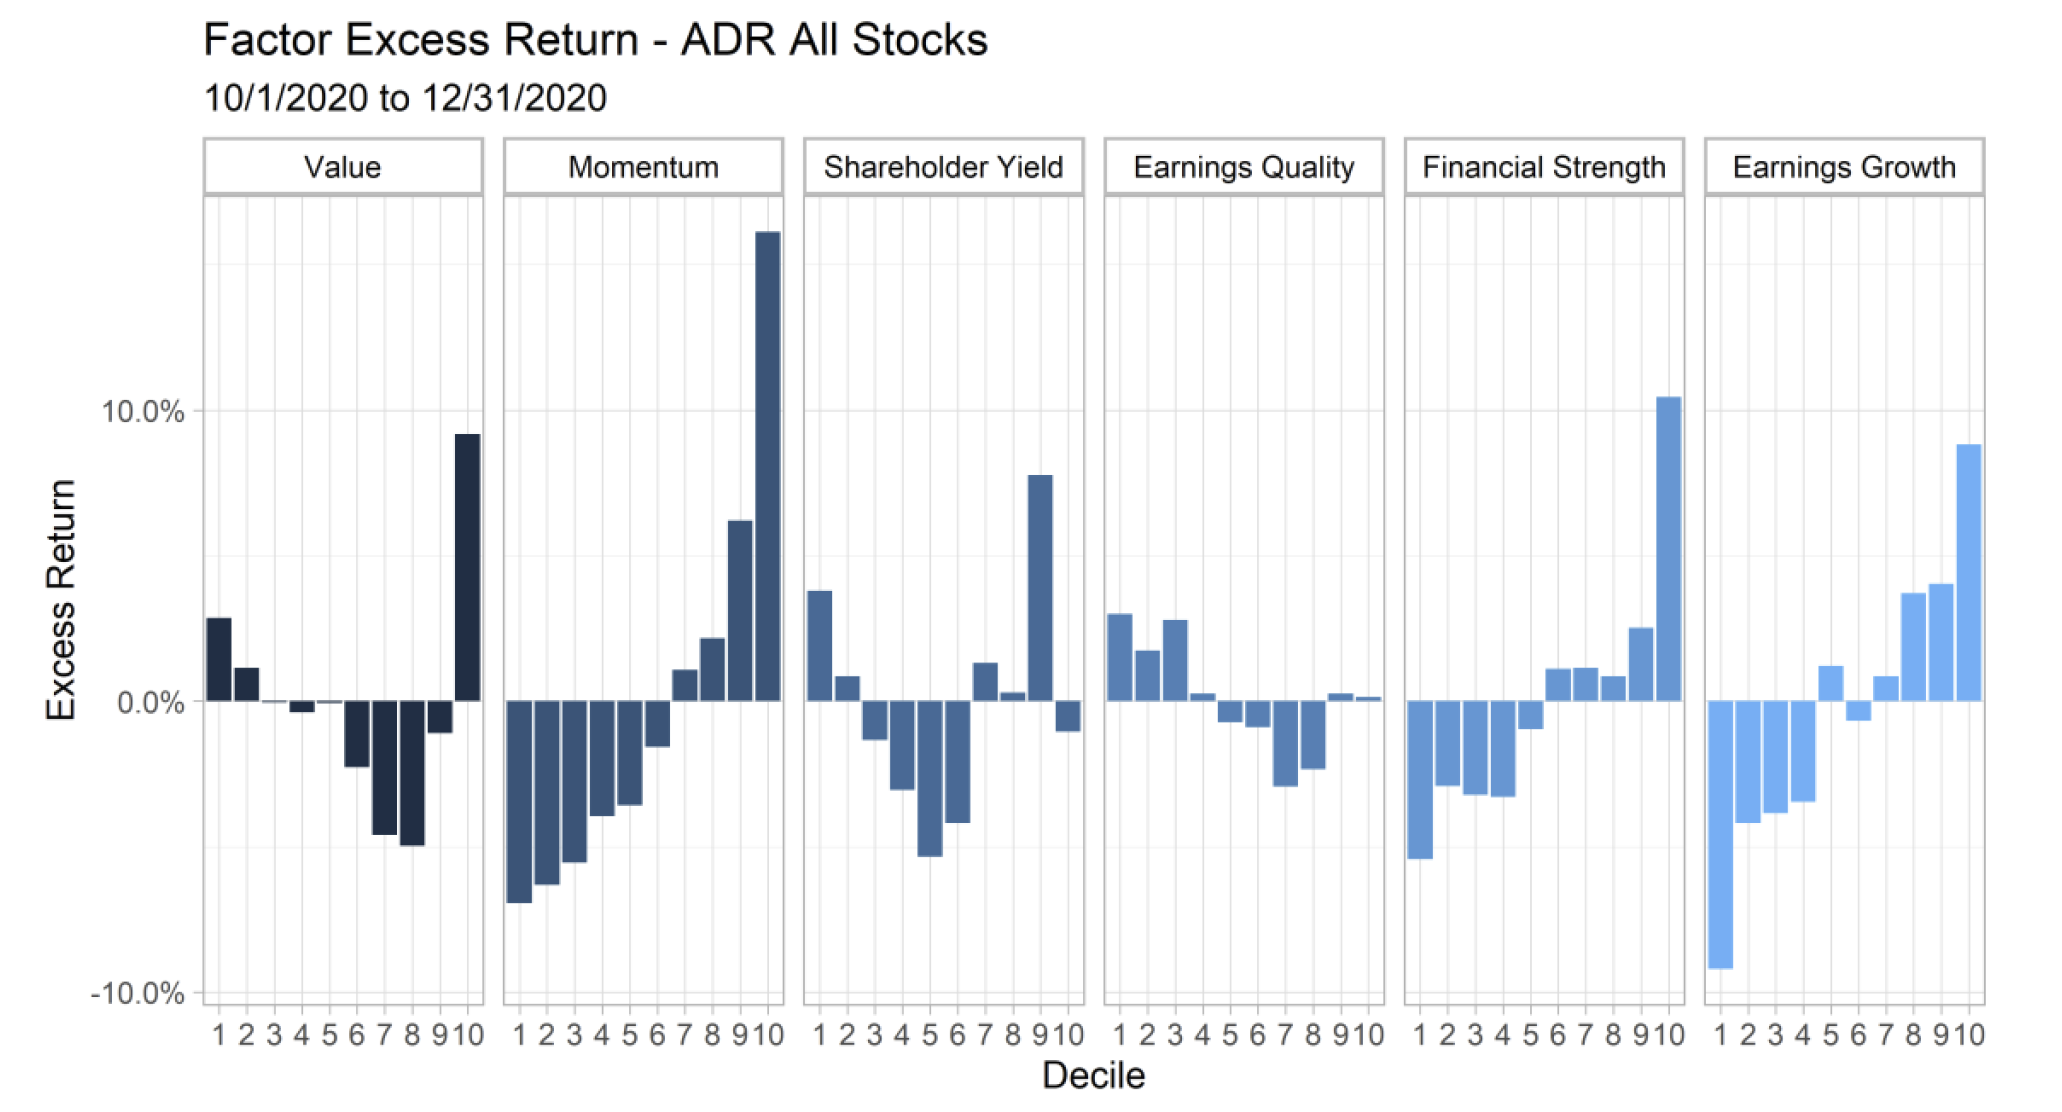
The chart above shows factor performance within our ADR All Stocks universe across our six key stock selection themes. From left to right—Value exhibited the same strange U-shaped distribution as in the U.S. Momentum inverted. Shareholder Yield, like Value, followed the U-shaped distribution. For our quality themes, the top and bottom deciles for Earnings Quality outperformed, while Financial Strength and Earnings Growth inverted on the quarter—meaning poor quality outperformed.
The table below shows the weight to each sector for ADR All Stocks as of 9/30/2020 and the subsequent 4Q performance by sector within the cheap and expensive deciles of Value.
While cheap stocks derived their excess return from selection within Materials and Discretionary exposures, expensive stocks achieved their greater edge from beaten down Energy, even better Discretionary exposure, and Info Tech. As was the case in the U.S., you wanted to invest in either cheap stocks or expensive ones, but nothing in between.
Factor performance on the year was largely consistent with the U.S. with Value experiencing the most outsized inversion. The spread in performance between cheap & expensive stocks on the year ended at 57%.
Current Positioning and Outlook
Most pivotal moments in history are only deemed ‘historic’ after they transpired and the benefits of hindsight unveil their true impact. On rare occasions, however, we can identify a historic event in real-time. The 2020 calendar year is a prime example.
This past year was historic for a myriad of reasons, but most notably the global shutdown of economic activity and shelter-in-place mandates at an unprecedented scale. As a species, we tend to look to the past for comfort in times of uncertainty, and in this instance a parallel was found almost exactly 100 years ago in 1918 with the Spanish Flu. The similarities with our modern situation are striking, as the 1918 Spanish Flu was followed by a series of nationwide protests and riots sparked by racial tension during what was later called “The Red Summer of 1919”. Shortly thereafter, our nation held a presidential election. A familiar progression.
Deployment Phase
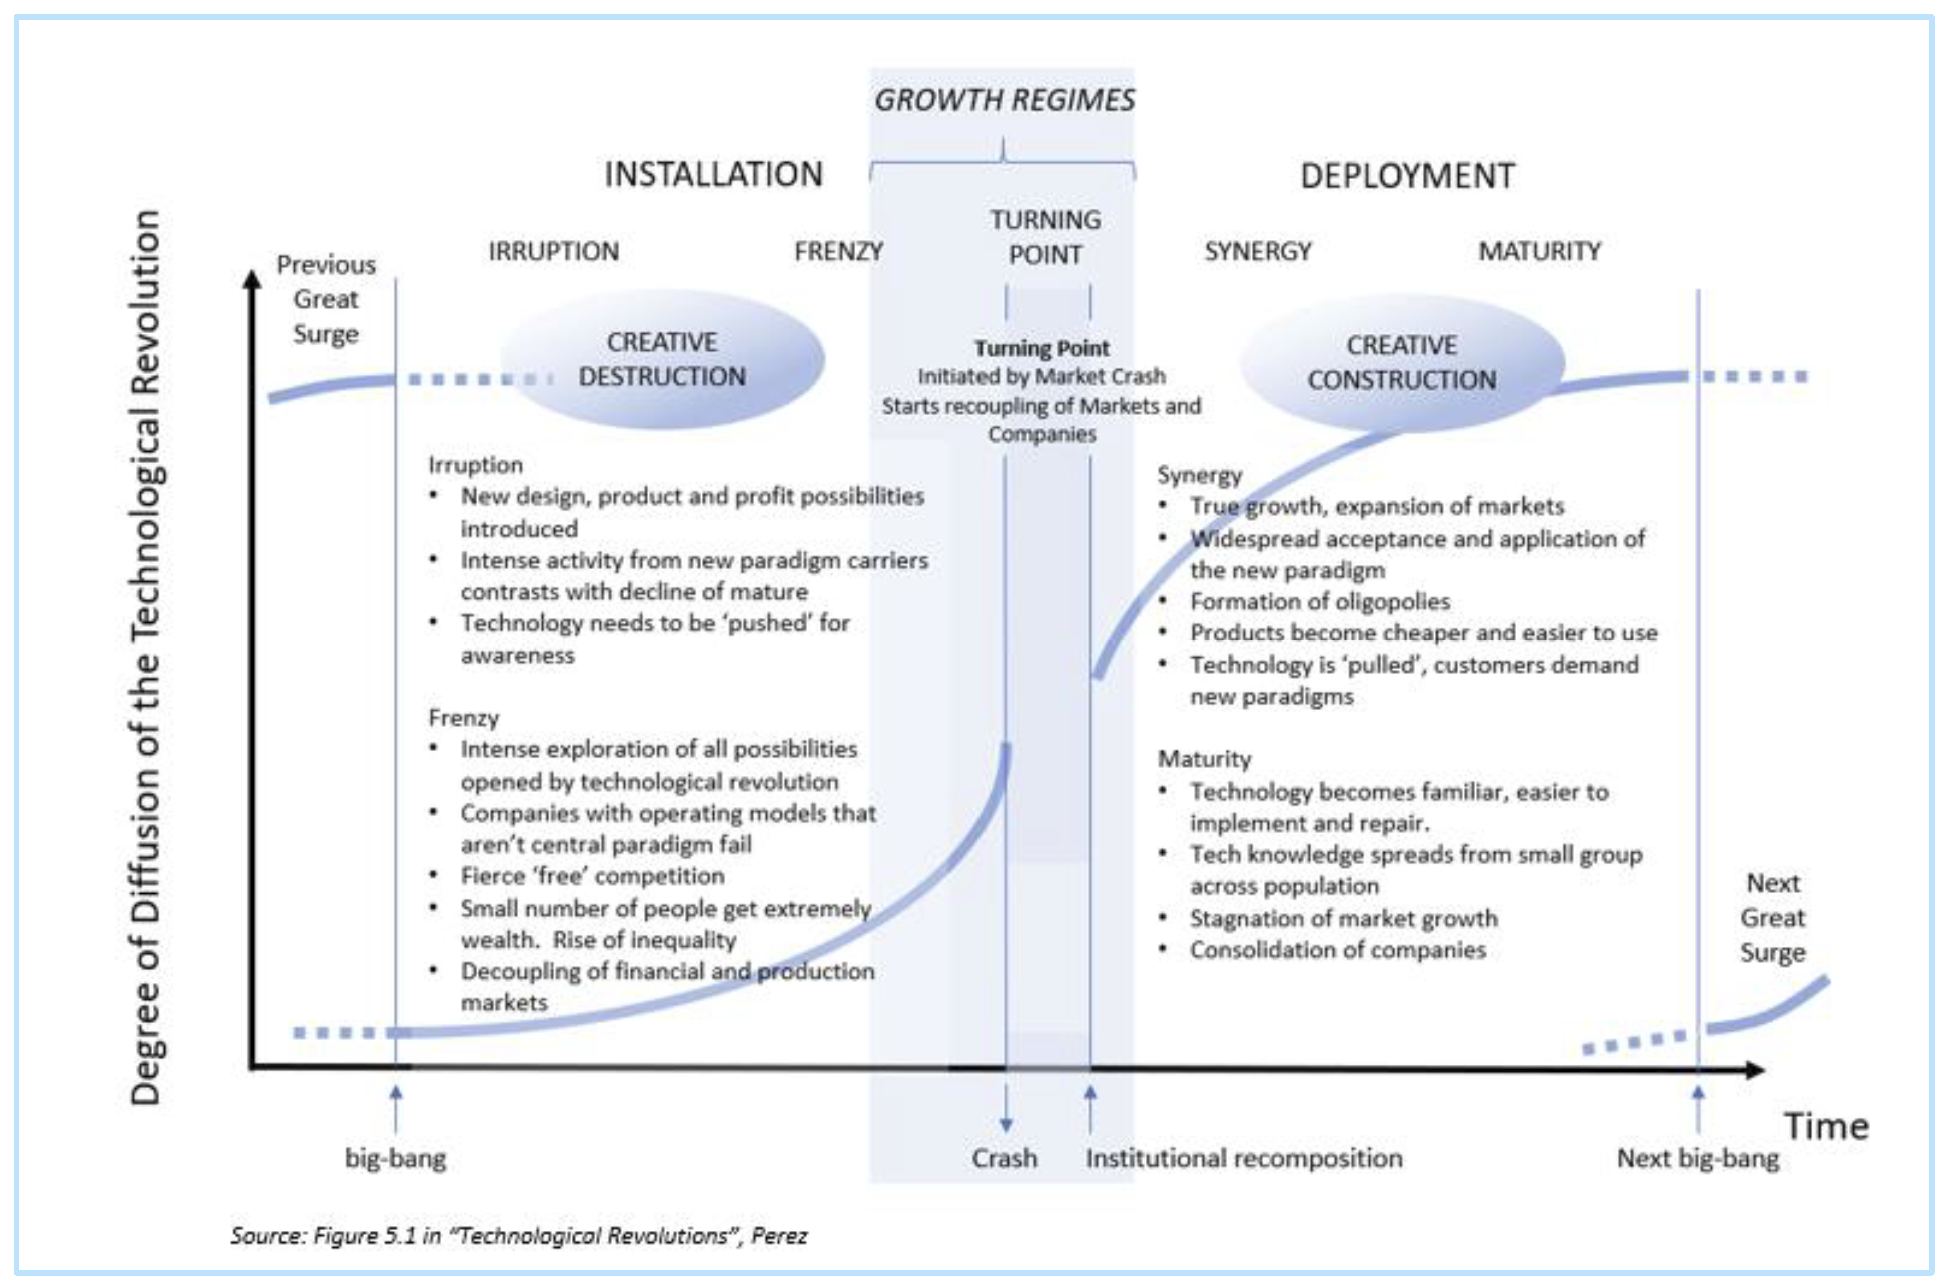
In our 2019 whitepaper titled Value is Dead, Long Live Value we analyzed the Value vs. Growth dynamic through the lens of past ‘Technological Revolutions’. These revolution cycles (depicted below) can be summarized as clusters of new technologies that cause economic upheaval over decades-long periods. They begin with the discovery of an innovation, an ‘Installation’ phase where the infrastructure to make it scalable is built, and a “Deployment” phase with strong coherent growth as adoption of the innovation spreads across the broader economy. Eventually, the cycle reaches maturity as growth stagnates.
The 4th Technological Revolution (1908 – 1974) is particularly relevant because of how the innovation of that cycle – automobiles and mass manufacturing – transformed the broader American economy and society. The introduction of mass-produced automobiles in 1908 with Henry Ford’s Model T had a significant impact outside the auto industry as Ford’s assembly-line process was adopted by newly created industries like home appliances.
One of the major knock-on effects of the automobile, however, was its impact on Retail. Although hard to imagine today, before the automobile one could not simply “drive to the store” and shop. Like the internet changed retail with e-commerce, the automobile revolutionized consumer behavior and altered how retailers operated. The Amazon of the day, Sears, evolved from a mail-order catalog business to one dominated by retail stores as the company recognized consumers in outlying areas could suddenly access retail centers because of the automobile. The first Sears store opened in Chicago in 1925, and by 1929 the company boasted 300 locations. In 1931 the company’s retail sales topped mail-order catalogs for the first time.
The Next Frontier
Many investors and commentators have remarked that COVID-19 has accelerated the trends that were already unfolding pre-pandemic. One of those trends has been the adoption of software and digital infrastructure outside of the tech-heavy sectors like Information Technology & Communication Services.
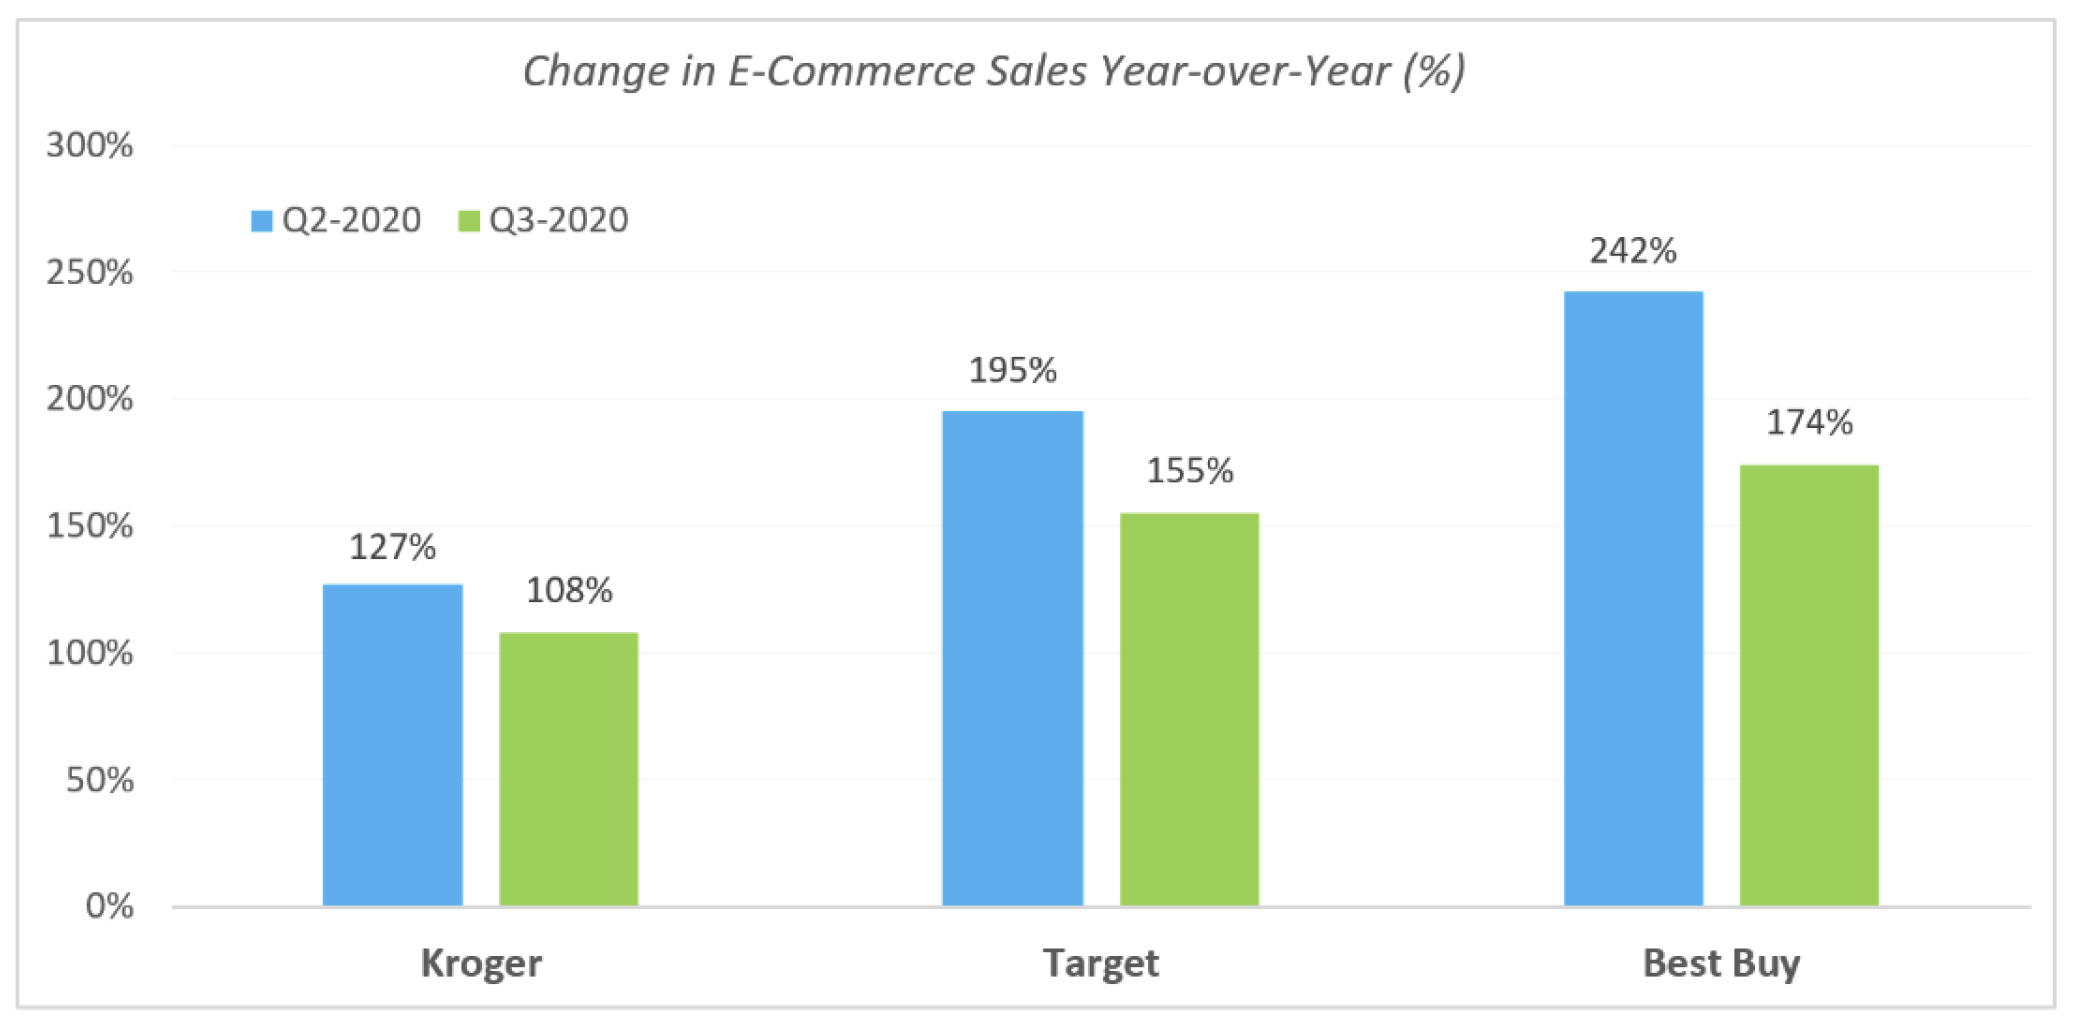
Brick-and-mortar retailers, for example, were forced into building extensive e-commerce networks after some stores were forced to close in government shutdowns, and all suffered precipitous declines in foot traffic. Like Sears expanded its retail presence following the birth of automobiles, traditional brick-and-mortar retailers have pivoted to an expanded online presence due to the pandemic.
The results below exhibit a few companies that successfully expanded their e-commerce presence and were held in some of our models.
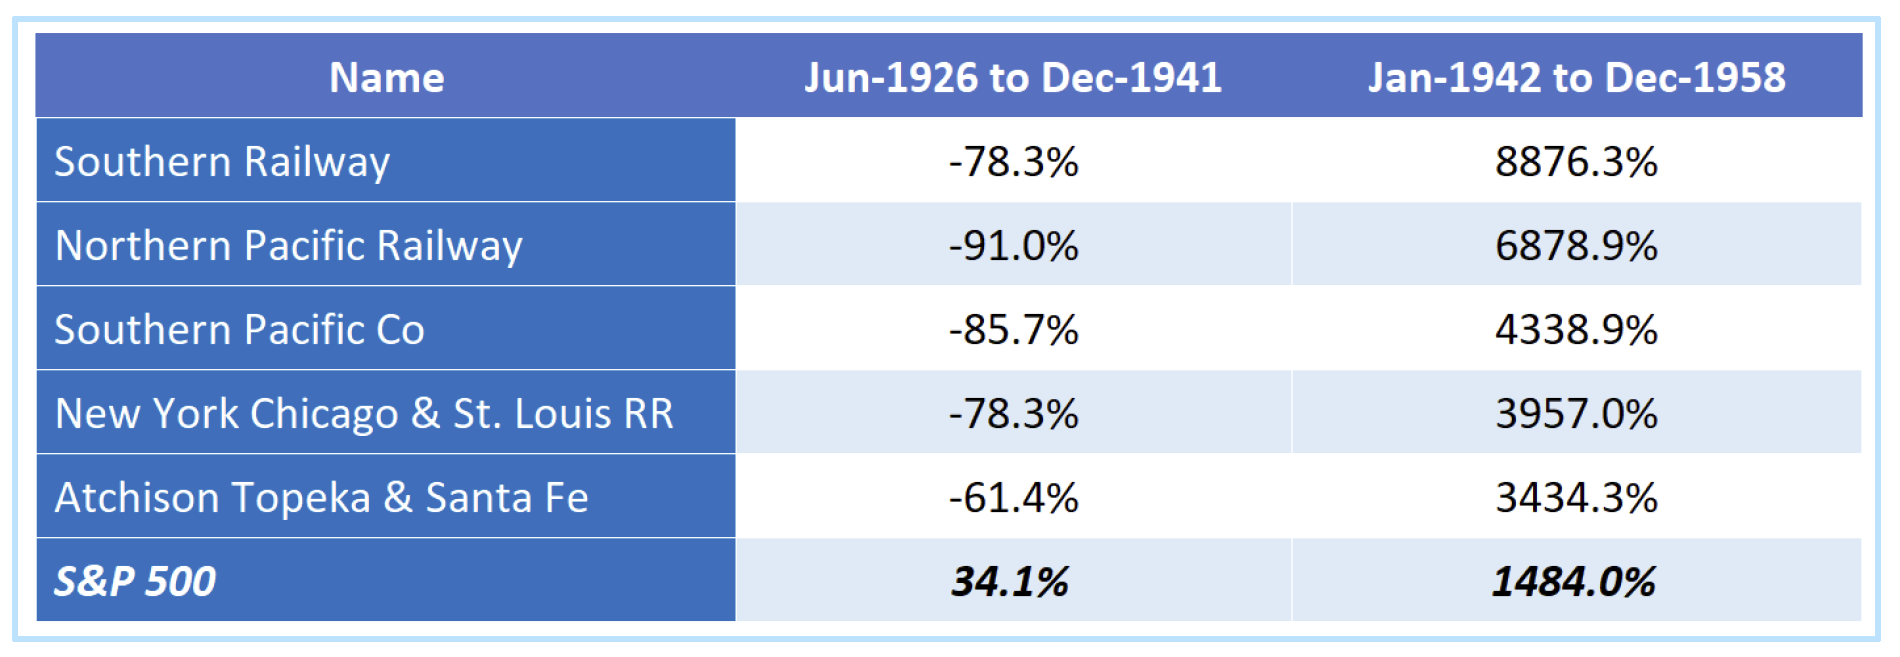
In the 4th Technological Revolution, the Value stocks that severely underperformed in the early part of the cycle went on to generate meaningful outperformance as technological innovations were adopted across the broader economy. We mentioned Sears, but Railroad stocks offer further evidence of Value’s strong performance after innovations in a Technological Revolution diffuse across the broader economy. After initially losing business to their cheaper trucking competitors that utilized the innovative combustion engine, leading Railroad stocks declined some 80% from 1926-1941. Yet, after adopting the innovation themselves through the dieselization of their engines – which brought down costs – stocks like Southern Railway went on to return +8,000% over the ensuing 15 years.
On the backs of strong performance in the fourth quarter, and the evolving dynamics discussed earlier, we believe that Value could extend its outperformance in the coming years as legacy companies outside of the tech sector have adopted the innovative software and e-commerce presence that has aimed to disrupt their businesses for years. Revitalized companies like a Target or Kroger are prime examples of what can happen when companies with good business practices and balance sheets adopt a new technology that further empowers their operations and business growth.
As we head into 2021, the wall of worry seems to have been taken down a few notches. The U.S. election will move to the rear-view. Given the outcome of the Georgia runoff, it would seem politically advantageous for the incoming administration to push for additional stimulus. Continued vaccine distribution, even if slower than anticipated, will likely be stimulus in and of itself. As of January 5th, 15 million doses have been administered. Literally, billions more will be distributed--a logistical challenge our world has never attempted and a triumph that will be celebrated. After four years of tenuous Brexit negotiations, a midnight deal was agreed that facilitates trade without tariffs and goods quotas--a plus for Europe's nascent recovery.
As we move beyond some specific event risk, there is certainly enough to worry about. Will the Fed and other Central Banks extricate themselves from asset markets? How will they? Will U.S.-Sino tensions flare up again under the new administration? Will the vaccine be effective enough to finally rid us of lockdowns? To all these questions and many more, the honest answer is that we just don't know. As such, we position portfolios in ways that historically tilt the odds in investors favor across many different regimes – high and low inflation, high and low economic growth, commodity booms and busts, technological disruption and deployment.
By concentrating our portfolios into the companies that exhibit strong balance sheets, record stronger earnings growth than the benchmark, and return capital to shareholders at supernormal rates, we believe that we are well positioned to capitalize on the current environment.
Regardless of what the equity market holds in store for us, we’ll continue to focus on adding value through tax management (where applicable), trade execution, and mitigating real world costs. For those portfolios with factor exposures, we will attempt to position them with strong and consistent characteristic advantages versus their benchmark and relative to the overall market across our Quality, Value, Momentum, and Yield factor themes.
GENERAL LEGAL DISCLOSURES & HYPOTHETICAL AND/OR BACKTESTED RESULTS DISCLAIMER
The material contained herein is intended as a general market commentary. Opinions expressed herein are solely those of O’Shaughnessy Asset Management, LLC and may differ from those of your broker or investment firm.
Please remember that past performance may not be indicative of future results. Different types of investments involve varying degrees of risk, and there can be no assurance that the future performance of any specific investment, investment strategy, or product (including the investments and/or investment strategies recommended or undertaken by O’Shaughnessy Asset Management, LLC), or any non-investment related content, made reference to directly or indirectly in this piece will be profitable, equal any corresponding indicated historical performance level(s), be suitable for your portfolio or individual situation, or prove successful. Due to various factors, including changing market conditions and/or applicable laws, the content may no longer be reflective of current opinions or positions. Moreover, you should not assume that any discussion or information contained in this piece serves as the receipt of, or as a substitute for, personalized investment advice from O’Shaughnessy Asset Management, LLC. Any individual account performance information reflects the reinvestment of dividends (to the extent applicable), and is net of applicable transaction fees, O’Shaughnessy Asset Management, LLC’s investment management fee (if debited directly from the account), and any other related account expenses. Account information has been compiled solely by O’Shaughnessy Asset Management, LLC, has not been independently verified, and does not reflect the impact of taxes on non-qualified accounts. In preparing this report, O’Shaughnessy Asset Management, LLC has relied upon information provided by the account custodian. Please defer to formal tax documents received from the account custodian for cost basis and tax reporting purposes. Please remember to contact O’Shaughnessy Asset Management, LLC, in writing, if there are any changes in your personal/financial situation or investment objectives for the purpose of reviewing/evaluating/revising our previous recommendations and/or services, or if you want to impose, add, or modify any reasonable restrictions to our investment advisory services. Please Note: Unless you advise, in writing, to the contrary, we will assume that there are no restrictions on our services, other than to manage the account in accordance with your designated investment objective. Please Also Note: Please compare this statement with account statements received from the account custodian. The account custodian does not verify the accuracy of the advisory fee calculation. Please advise us if you have not been receiving monthly statements from the account custodian. Historical performance results for investment indices and/or categories have been provided for general comparison purposes only, and generally do not reflect the deduction of transaction and/or custodial charges, the deduction of an investment management fee, nor the impact of taxes, the incurrence of which would have the effect of decreasing historical performance results. It should not be assumed that your account holdings correspond directly to any comparative indices. To the extent that a reader has any questions regarding the applicability of any specific issue discussed above to his/her individual situation, he/she is encouraged to consult with the professional advisor of his/her choosing. O’Shaughnessy Asset Management, LLC is neither a law firm nor a certified public accounting firm and no portion of the newsletter content should be construed as legal or accounting advice. A copy of the O’Shaughnessy Asset Management, LLC’s current written disclosure statement discussing our advisory services and fees is available upon request
The risk-free rate used in the calculation of Sortino, Sharpe, and Treynor ratios is 5%, consistently applied across time
The universe of All Stocks consists of all securities in the Chicago Research in Security Prices (CRSP) dataset or S&P Compustat Database (or other, as noted) with inflation-adjusted market capitalization greater than $200 million as of most recent year-end. The universe of Large Stocks consists of all securities in the Chicago Research in Security Prices (CRSP) dataset or S&P Compustat Database (or other, as noted) with inflation-adjusted market capitalization greater than the universe average as of most recent year-end. The stocks are equally weighted and generally rebalanced annually
Hypothetical performance results shown on the preceding pages are backtested and do not represent the performance of any account managed by OSAM, but were achieved by means of the retroactive application of each of the previously referenced models, certain aspects of which may have been designed with the benefit of hindsight
The hypothetical backtested performance does not represent the results of actual trading using client assets nor decision-making during the period and does not and is not intended to indicate the past performance or future performance of any account or investment strategy managed by OSAM. If actual accounts had been managed throughout the period, ongoing research might have resulted in changes to the strategy which might have altered returns. The performance of any account or investment strategy managed by OSAM will differ from the hypothetical backtested performance results for each factor shown herein for a number of reasons, including without limitation the following:
- Although OSAM may consider from time to time one or more of the factors noted herein in managing any account, it may not consider all or any of such factors. OSAM may (and will) from time to time consider factors in addition to those noted herein in managing any account.
- OSAM may rebalance an account more frequently or less frequently than annually and at times other than presented herein.
- OSAM may from time to time manage an account by using non-quantitative, subjective investment management methodologies in conjunction with the application of factors.
- The hypothetical backtested performance results assume full investment, whereas an account managed by OSAM may have a positive cash position upon rebalance. Had the hypothetical backtested performance results included a positive cash position, the results would have been different and generally would have been lower.
- The hypothetical backtested performance results for each factor do not reflect any transaction costs of buying and selling securities, investment management fees (including without limitation management fees and performance fees), custody and other costs, or taxes – all of which would be incurred by an investor in any account managed by OSAM. If such costs and fees were reflected, the hypothetical backtested performance results would be lower.
- The hypothetical performance does not reflect the reinvestment of dividends and distributions therefrom, interest, capital gains and withholding taxes.
- Accounts managed by OSAM are subject to additions and redemptions of assets under management, which may positively or negatively affect performance depending generally upon the timing of such events in relation to the market’s direction.
- Simulated returns may be dependent on the market and economic conditions that existed during the period. Future market or economic conditions can adversely affect the returns.