They Can’t All Be That Smart
By Chris MeredithJuly 2017
A DUE DILIGENCE FRAMEWORK FOR FACTOR INVESTORS
Not all factor products are smart. This paper delineates the differences between factor-based strategies: fundamental weighting, smart beta, and Factor Alpha. This paper also provides a framework to determine the alignment between factors and portfolio construction, as well as the fees you should pay.
- Fundamental Weighting
Weighting on sales or earnings is an indirect value signal, but without controlling for price.
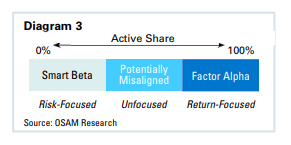
- Risk-Focused vs. Return-Focused
Highlights two fundamentally different views of how to implement factors: Smart beta is focused on risk; Factor Alpha is focused on returns.
- Risk Controls
Risk controls help augment a return-focused Factor Alpha process
- Using Active Share
Active Share can be a useful tool for allocators to understand alignment of alpha signal and portfolio construction, as well as understand appropriate fee structures
“Smart beta” is a label applied broadly to all factor-based investment strategies. In a recent WSJ article on smart beta, Yves Choueifaty, the CIO of TOBAM, remarked, “There’s a huge range of possibilities in the smart- beta world, and they can’t all be that smart.”1 With the wide range of implementation styles for factor investors, there has to be wide differences in the expected return and risk profiles. This paper separates the factor investing landscape and helps analyze the edges of various approaches.
Analysis of a factor-based investing strategy should focus on two of the manager’s skills: the ability to identify specific factors that accurately generate outperformance and the manager’s technique in constructing a portfolio of stocks with those factors. Factors are not commodities2 and one should know how managers are selecting stocks, but we are focusing on portfolio construction and the soundness of different approaches.
Active Share can be a useful tool in this investigation. Active Share by itself is not a metric that inherently identifies manager skill. Nor is it a strong metric to determine the risk of the portfolio versus an active benchmark; Tracking Error is a more comprehensive metric at the trailing differences in the portfolio returns and Information Ratios for understanding the balance of how much active risk you are taking for active return. But Active Share is a very useful tool in investigating the choices managers make in building factor portfolios.
Through the lens of Active Share, Tracking Error, and Information Ratio, we consider the relative merits of three factor-based portfolio construction approaches: fundamental weighting, smart beta, and Factor Alpha. Understanding the differences between these approaches will help you better incorporate factors into your overall portfolio.
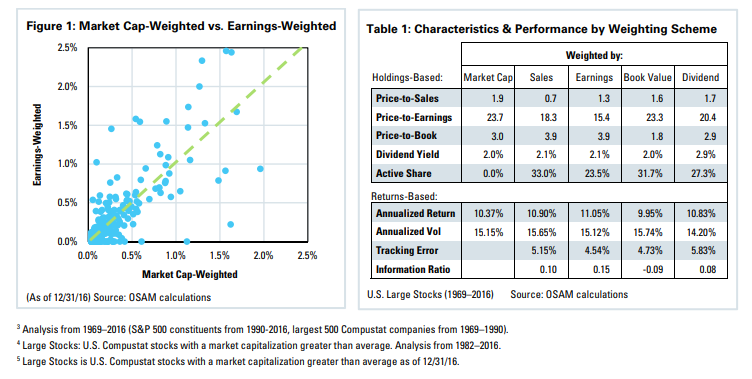
Fundamental Weighting
Most benchmarks weight constituents by market capitalization. Some factor investing approaches pivot away from weighting on market cap, and weighting on another fundamental factor like sales or earnings. The argument for these strategies is that weighting by market cap is not the smartest investment solution out there: the top quintile of the S&P 500 by market cap underperforms the average stock by 0.65 percent annualized,3 and market-cap weighting allocates 65 percent of the benchmark to those largest names.
For a comparison of fundamental weighting schemes, the table below shows the characteristics and annualized returns for weighting on Market Cap, Sales, Earnings, Book Value of Equity, and Dividends. There are some benefits to the approach, for example eliminating companies with negative earnings. On average, about 8.3 percent of Large Stocks companies are generating negative earnings,4 and avoiding those is smart. The largest benefit is an implied value-tilt to the strategy: overweighting companies with strong earnings and average market caps creates an implicit Price/Earnings tilt. This is apparent in the characteristics table: Sales-weighting gives the cheapest on Price/Sales, Dividend-Weighted gives the highest yield, and so on.
But pivoting from market cap to a fundamental factor weighting scheme does not create large risk-return benefits. Raw fundamental factors correlate highly with market cap: companies with huge revenues tend to have large market caps. As of December 31, 2016, weighting on Earnings has a 0.85 correlation with weighting on market cap.5 In market cap weighting, the top 25 names are 34 percent of the portfolio. In an earnings-weighted scheme those same 25 companies are still 34 percent of the portfolio, just shifting weights a bit from one name to another.
Active Share shows how little fundamental weighting moves the portfolios, which have Active Shares in the 20–30 percent range. Excess returns range from slightly underperforming market cap to outperforming by +72bps. The modest excess return comes with much higher active risk, and tracking errors ranging from 4.5 percent to 5.8 percent. This generates poor Information Ratios (the ratio of active return to active risk).
The reason that the risk-return benefits are small is because Fundamental Weighting is an indirect allocation to a Value strategy. Value investing on ratios is identifying investment opportunities with the comparison of a fundamental factor in the context of the price you pay. Fundamental weighting is only taking half of the strategy into account, looking for large earnings but ignoring the price you’re paying for them. Some Fundamental-Weighted products will more sophisticated than simply weighting on sales, earnings, book value or dividends. But weighting on fundamental factors instead of market cap doesn’t create a significant edge.
Risk-Focused vs. Return-Focused
In a November 2016 article posted by AQR founder Cliff Asness, he states that smart beta portfolios should focus on “minimizing Active Share.”6 Also, smart beta portfolios are “only about getting exposure to the desired factor, or factors, while taking as little other exposures as possible.” This statement cemented the idea that there is a group of smart beta products that are risk-focused in nature: start with the market portfolio, identify your skill and then take only the exposure on those factors.
In evaluating this portfolio construction technique, let’s suspend the idea that we’re all starting with unique factors and take a hypothetical example where the skill of all quant managers is a generic factor with only three states: Good, Neutral, and Bad. Most of the stocks (80 percent) are Neutral and give a market return, while you have an equal amount of Good stocks give an alpha of +4 percent, and Bad stocks underperform by 4 percent. To establish some terminology: the strength of the signal is +4 percent alpha and the breadth of the signal is the top and bottom 10 percent.
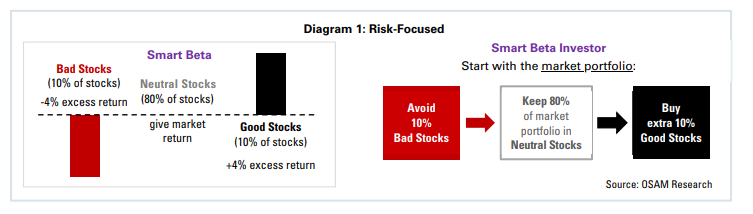
In the risk-focused smart beta framework, you only deviate from the benchmark when you have strong conviction. In this case, start with the market, and then “sell” (do not own) the 10 percent of the market you’ve identified as bad stocks to “buy” (double down on) the 10 percent you’ve identified as good stocks. For the remaining 80 percent of the market, you have no edge—so match the market portfolio. The logic seems sound: you’ve maximized the usage of your skill within your risk-focused framework. Only change the stocks you have an opinion on, and if you have no opinion, leave the portfolio at market exposure.
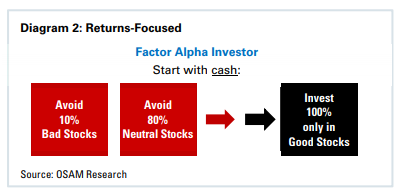
Another equally viable framework is to focus on returns first. Using the same example where there is a group of stocks with an excess return of +4 percent annualized, a return-focused manager would only own stocks from that group and then try to balance out the risks of the portfolio to match the market’s risk factors. Let’s call this the “Factor Alpha” approach, which focuses on maximizing excess returns first, and then controls for risks.
Portfolio Construction in Practice
A sensitivity analysis based on a single factor can demonstrate test how the breadth of signal affects the risk-return profile of either approach. The Universe for this analysis is a modified Russell 1000. The market-cap weighting methodology of the Russell benchmark includes a long tail of mid-cap to small cap names. To get around this, only the top 95 percent of names by market cap are included, trimming a long-tail of small-cap companies. Portfolios are formed monthly with a 12-month holding period, with analysis on the combined portfolio.
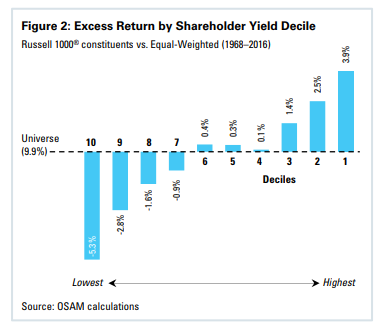
The factor used in the analysis was Shareholder Yield, which is the net return of capital through dividend yield and buyback yield. The following chart show the annualized returns for portfolios grouped into deciles by Shareholder Yield. There is significant outperformance from the highest shareholder-yielding decile and underperformance from the lowest-yielding decile. The relative performance narrows quickly, with declining utility in the second and third deciles. The returns of the fourth to seventh decile demonstrate little edge and these groups should be considered low-conviction.
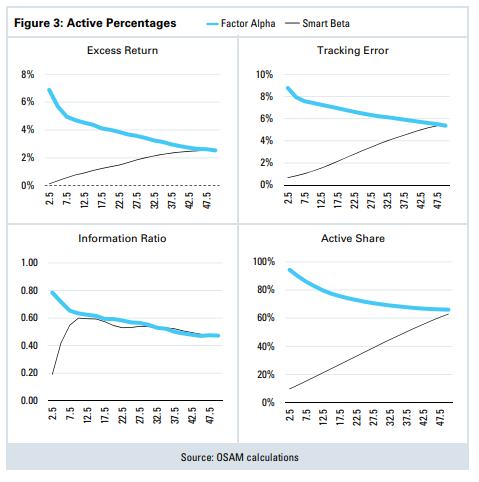
Using Shareholder Yield as our basic alpha signal, the analysis was run for both the smart beta approach and Factor Alpha approach, using a different cutoff for the breadth of signal. The universes are the same, and the alpha signal is the same, but we are scaling in how much confidence we have in our alpha signal. For the smart beta approach, we are increasing the active component of the portfolio and reducing the passive component by increments of 2.5 percent. To be specific, at 10 percent we have trimmed the top and bottom deciles, equally-weighted the names within the top decile with the combined weight of both groups. For the Factor Alpha approach, we start by purchasing the groupings based on the top 2.5 percent, and incrementally decreasing the concentration of the portfolio by 2.5 percent. At 10 percent, we are only purchasing the equally-weighted top decile, and no other constituents.
In Figure 3 (see next page), the excess return and tracking error match our intuitive expectations: the smart beta approach starts with little excess return and little active risk, and both return and risk scale up the more active one gets. The Factor Alpha approach starts with high excess return and higher active risk and scales down the broader the portfolio gets. What’s interesting is that the Information Ratio, the balance of active returns and risk converge fairly quickly. To be fair, for the first few groupings, the smart beta approach is working from a very low tracking error where a shift in excess return of just a few basis points has a significant impact on Information Ratio. But by the time the portfolio gets to the top decile, the Information Ratios from each approach converge. The smart beta and Factor Alpha approaches generate very competitive risk-return profiles, although the overall level of active return and risk are higher in the Factor Alpha Approach.
In both approaches, the Information Ratio then degrades the further you dig deeper into your alpha signal. The reason for the degradation is that benefit of the alpha signal. For Shareholder Yield, the active return drops off more quickly than the active risk, degrading the risk-return profile for either approach. A key aspect of Modern Portfolio Theory is the Benefit of Diversification: the total risk of the portfolio is reduced by holding more securities. In factor investing, there is also a Benefit of Concentration: the total return of the portfolio is increased by holding securities with stronger factors. As you dig deeper to lower conviction names in the active component of the portfolio, the edge from factor returns is diluted.
To make sure this is kept in context, this is a very basic example using one factor as the alpha signal. Active quantitative managers have a lot more factors available than just Shareholder Yield and can boost their alpha signal beyond the single factor. But for large cap stocks, Shareholder Yield provides a pretty reasonable expectation on alpha signals: the highest- and lowest-scoring stocks by a factor will have the highest outperformance and lowest underperformance, but as the characteristics degrade the excess returns diminish. Alpha signals are just not as effective as the universe broadens. It is unlikely that a manager has discovered the perfect investment signal separating the universe in half between equal conviction winners from losers. When evaluating a manager’s construction choices, investors should search for conviction around the breadth of their alpha signal.
Using Risk Controls
Changing weighting schemes creates active risk with the passive market cap-weighted benchmark. The portfolio construction process used above was basic as the active constituents were equally weighted. This active weighting creates the opportunity for outperformance, but also creates differences with the benchmark. Part of this risk comes from the alpha source: investing in high-yielding companies does generate excess return over long periods of time, but can also create periods of time when it underperforms. But some of the risk comes from other bets created when the portfolio is formed: differences in sectors, like an overweight to Energy, or differences in factors, like an underweight to Market Cap.
Sector differences are a large driver in these differences of returns. The following table shows some of the choices made in the basic analysis above. When trimming the bottom 5 percent of stocks by market cap to avoid small caps, you introduce 46bps of tracking error. But when moving from the market cap-weighted portfolio to equallyweighted constituents, the tracking error jumps to over 4 percent. This is the same universe of stocks as the market cap-weighted, but simply unwinding the market-cap factor used in the passive benchmark creates large active risk for the portfolio.
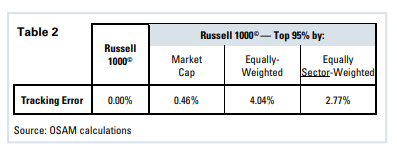
To manage active risk, you can adjust the portfolio from equally-weighted to a risk-controlled weighting on sectors. In the basic example below, by controlling for active sector allocations and shaping the portfolio back to the same weightings as the benchmark can remove over 125bps of the active risk.
The question is how broad of a portfolio do you need in order to take advantage of risk controls like sector awareness. Taking this same usage of sector risk-controls back to the Factor Alpha framework, another analysis was run utilizing the same percentages of Shareholder Yield, but with an additional set of risk controls to reduce exposures versus the benchmark. To be explicit, the portfolios are formed selecting on the strength of a factor, but instead of equally-weighting the stocks we see if we can shape the portfolio to get the sector exposures as close as possible to the benchmark. Sector weightings are not neutralized, as the focus is on generating excess return through factors, but they are more controlled than in an equallyweighted portfolio.
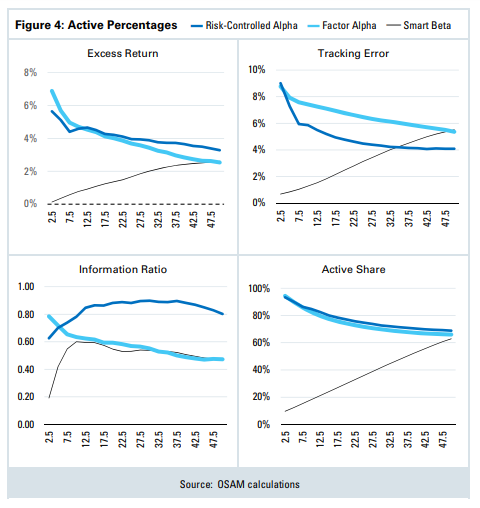
With highly concentrated portfolios of only 2.5 percent to 5 percent of the universe, there is little room to maneuver the portfolio sectors. But by the time we have expanded to just the top decile of the factor, which is only about 30 to 50 names, risk-controls are able to shape the portfolio and reduce the overall active risk. This approach reduces active risk while maintaining the same profile of excess returns and active exposures versus the benchmark, increasing the risk-adjusted return through the Information Ratio significantly.
There are a number of ways to introduce risk controls, through risk models or explicit constraints. And smart beta also has the ability to add risk controls. The difference is again going to be on the philosophy of what is being delivered. The smart beta approach starts with de minimis risk, and gradually dials up alpha. A Factor Alpha approach has the ability to deliver significant excess return while managing active risk in the portfolio.
Through the Lens of Active Share: Validating Portfolio Construction
Not all factor-based investing approaches are smart, but there are several different ways to construct smart portfolios. Both smart beta and Factor Alpha approaches can generate strong risk-return profiles, with one approach focusing on risk while the other focuses on returns, but in either approach there can be misalignment between the return of factors and the portfolio construction methodology.
When analyzing a factor portfolio, you should determine (1) the breadth of the excess return from the alpha signal and (2) whether the manager is using a risk-focused smart beta or a return-focused Factor Alpha approach. In either approach, Active Shares should line up with where signal conviction diminishes. If they don’t, it’s possible that the manager has a misalignment in portfolio construction.
Through the Lens of Active Share: Analyzing Fees
Active Share also helps establish what the fee of a product should be. It disaggregates the passive component of every strategy, contextualizing the fees being paid to an active manager. Fees are under a tremendous pressure in our industry. The 2016 ICI Factbook shows that, since 2000, the average fee paid to equity mutual fund managers has declined from 99bps to 68bps, a decline of 31 percent. The shift to passive management has been a component of this, but fee renegotiation is part of the decline. The average fee on active equity has declined from 106bps to 81bps, a decline of 21 percent, which means about half of the decline in overall fees paid is from compression of the fees paid to active management.
Active Share gives transparency to what you are paying for. The average passive index fund is at 11bps. The lowestcost ETFs are trading at 5bps, and large institutions can get passive exposure for a single basis point. What Active Share gives is a quick metric into how much of the portfolio is passive, with the idea that the passive component of investments is commoditized.
The difference between a smart beta and a Factor Alpha approach to building a portfolio shows why there should be a different fee structure between the two approaches. Smart beta comes with a large passive component to its portfolio, which should come at passive costs. The Factor Alpha approach has little passive exposure because the bulk of its investments are in the skill of the manager.
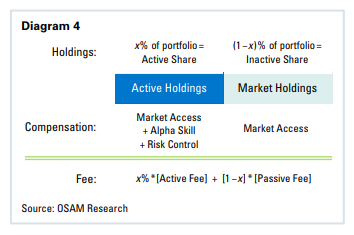
Both smart beta and Factor Alpha approaches allow for exposure to factors which can enhance returns, but the implementations are very different. After you figure out your cost for market access, there are only two inputs to determine what one should be willing to pay for a manager: what’s the estimated skill on the active component of the portfolio, and how much are you willing to pay for that skill?
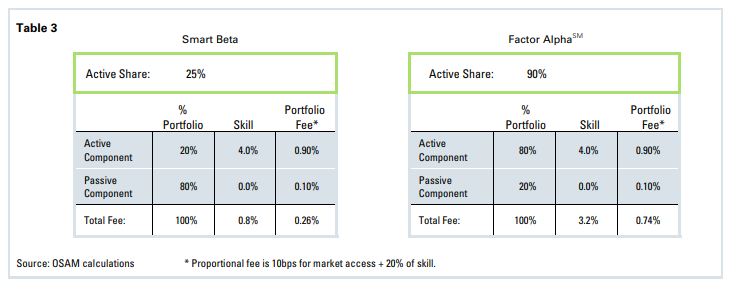
Once those two numbers are determined, they are simply inputs into the formula. Let’s propose a smart beta example where the cost of passive market access is 10bps, and the skill of the alpha is determined to be 4 percent and you’re prepared to pay 20 percent of alpha to get access to that skill. Based on the Active Share, you can determine an expected fee for the portfolio no matter the approach that it’s using.
Active Share helps identify misalignments between construction methodology and fees in the industry. The website Activeshare.info (launched in 2016) has constituent data for mutual funds and exchange traded funds and explicitly calculates the Active Fee using this same methodology, and can help investors determine misalignments. Misalignments in portfolio construction isn’t just limited to quantitative managers. Fundamental managers also struggle with quantifying their skill and how to implement it in a portfolio. With either approach, one should analyze low-Active Share portfolios with average to above-average fees to determine whether they have an incredible alpha source on their active component, or determine if they are misconstructed or mispriced. High Active Share at belowaverage fees offers an opportunity for lower cost access to investment skill, and the investigative burden should center on validating the skill of the manager.
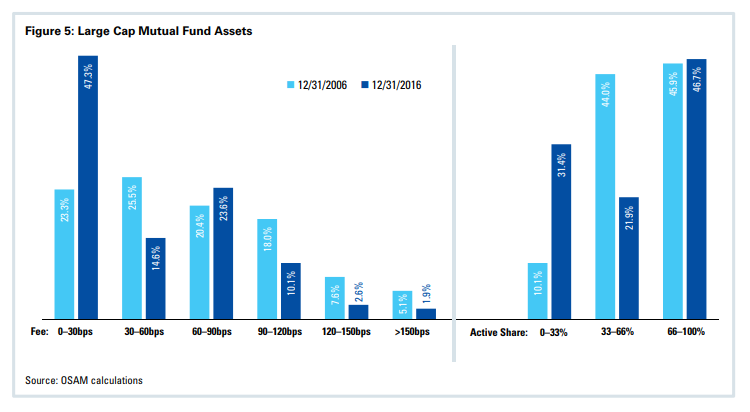
This may be old news to industry professionals. The following tables show the asset distribution of Large Cap Funds broken down by Active Share and Expense Ratios. The universe includes all mutual funds and exchange traded funds that have coverage in the CRSP Mutual Fund Database, and have holdings and returns in the database. Active share is broken into three groupings which broadly align with the Smart Beta, Potentially Misaligned, and Factor Alpha quantitative approaches. Fees are broken out by 30bps increments.
The table shows two distinct trends. The first is well known as the industry has shifted to lower fees, with almost half of fund assets now paying fees under 30bps and the average fee by assets is down 33 percent over the last 10 years.
There is a second trend in the industry over the last ten years: a shift away from the Potentially Misaligned. Almost the entire shift to passive investments has come from funds with an active share of 33–66 percent. It should be noted that these posts of 33–66 percent are arbitrary, but the trend maintains if you shift the breakpoints to 40 and 60 percent, or 25 and 75 percent. High Active Share strategies have only had a moderate loss to their overall market share. The shift within the space is leaving a “barbell” of solutions, moving towards a risk-focused passive or Smart Beta benchmark-aware process, or the highly active return-focused approach like Factor Alpha. If this trend is continuing, there is over $1.1 trillion remaining in the Potentially Misaligned funds and those funds—funds that are on the edge of either lower conviction or higher fee—will likely be next to see assets shift away from them.
SUMMARY
Understand the source of alpha.
Factors are not commodities, and can have large differences between quantitative managers. It’s important to not only know the strength of outperformance in the top names but also have an understanding of the breadth of the signal. The broader the alpha, the more appropriate it is to have a higher Active Share in smart beta, and a lower Active Share in a Factor Alpha approach. Most alphas degrade quickly after the top decile and turn low conviction by the top third of the universe.
“Smart beta” and Factor Alpha start with different goals.
Smart beta is an approach focused on minimizing risk, while Factor Alpha is focused on maximizing the excess return versus the benchmark. Both provide similar Information Ratios, which degrade at a rate determined by the alpha signal. But to borrow a common phrase in finance, “you can’t eat an Information Ratio”. To be more explicit, returns are going to achieve investors’ funding goals, not risk controls. Investors are looking for returns should consider Factor Alpha portfolios.
Risk controls matter.
In either approach, having a layer of risk controls significantly improves the risk-return profile. In Factor Alpha, you can maintain the excess return while lowering the excess risk, improving the Information Ratio significantly.
Investigate portfolios for construction alignment and fees.
Knowing a manager’s investment focus, Active Share and alpha signal allow for an advisor to determine if there is a misalignment in the construction of the portfolio. Active Share also helps determine whether the investment solution is priced appropriately.
General Legal Disclosures & Hypothetical and/or Backtested Results Disclaimer
The material contained herein is intended as a general market commentary. Opinions expressed herein are solely those of O’Shaughnessy Asset Management, LLC and may differ from those of your broker or investment firm.
Please remember that past performance may not be indicative of future results. Different types of investments involve varying degrees of risk, and there can be no assurance that the future performance of any specific investment, investment strategy, or product (including the investments and/or investment strategies recommended or undertaken by O’Shaughnessy Asset Management, LLC), or any non-investment related content, made reference to directly or indirectly in this piece will be profitable, equal any corresponding indicated historical performance level(s), be suitable for your portfolio or individual situation, or prove successful. Due to various factors, including changing market conditions and/or applicable laws, the content may no longer be reflective of current opinions or positions. Moreover, you should not assume that any discussion or information contained in this piece serves as the receipt of, or as a substitute for, personalized investment advice from O’Shaughnessy Asset Management, LLC. Any individual account performance information reflects the reinvestment of dividends (to the extent applicable), and is net of applicable transaction fees, O’Shaughnessy Asset Management, LLC’s investment management fee (if debited directly from the account), and any other related account expenses. Account information has been compiled solely by O’Shaughnessy Asset Management, LLC, has not been independently verified, and does not reflect the impact of taxes on non-qualified accounts. In preparing this report, O’Shaughnessy Asset Management, LLC has relied upon information provided by the account custodian. Please defer to formal tax documents received from the account custodian for cost basis and tax reporting purposes. Please remember to contact O’Shaughnessy Asset Management, LLC, in writing, if there are any changes in your personal/financial situation or investment objectives for the purpose of reviewing/evaluating/revising our previous recommendations and/or services, or if you want to impose, add, or modify any reasonable restrictions to our investment advisory services. Please Note: Unless you advise, in writing, to the contrary, we will assume that there are no restrictions on our services, other than to manage the account in accordance with your designated investment objective. Please Also Note: Please compare this statement with account statements received from the account custodian. The account custodian does not verify the accuracy of the advisory fee calculation. Please advise us if you have not been receiving monthly statements from the account custodian. Historical performance results for investment indices and/or categories have been provided for general comparison purposes only, and generally do not reflect the deduction of transaction and/or custodial charges, the deduction of an investment management fee, nor the impact of taxes, the incurrence of which would have the effect of decreasing historical performance results. It should not be assumed that your account holdings correspond directly to any comparative indices. To the extent that a reader has any questions regarding the applicability of any specific issue discussed above to his/her individual situation, he/she is encouraged to consult with the professional advisor of his/her choosing. O’Shaughnessy Asset Management, LLC is neither a law firm nor a certified public accounting firm and no portion of the newsletter content should be construed as legal or accounting advice. A copy of the O’Shaughnessy Asset Management, LLC’s current written disclosure statement discussing our advisory services and fees is available upon request.
The risk-free rate used in the calculation of Sortino, Sharpe, and Treynor ratios is 5%, consistently applied across time.
The universe of All Stocks consists of all securities in the Chicago Research in Security Prices (CRSP) dataset or S&P Compustat Database (or other, as noted) with inflation-adjusted market capitalization greater than $200 million as of most recent year-end. The universe of Large Stocks consists of all securities in the Chicago Research in Security Prices (CRSP) dataset or S&P Compustat Database (or other, as noted) with inflation-adjusted market capitalization greater than the universe average as of most recent year-end. The stocks are equally weighted and generally rebalanced annually. Hypothetical performance results shown on the preceding pages are backtested and do not represent the performance of any account managed by OSAM, but were achieved by means of the retroactive application of each of the previously referenced models, certain aspects of which may have been designed with the benefit of hindsight. The hypothetical backtested performance does not represent the results of actual trading using client assets nor decision-making during the period and does not and is not intended to indicate the past performance or future performance of any account or investment strategy managed by OSAM. If actual accounts had been managed throughout the period, ongoing research might have resulted in changes to the strategy which might have altered returns. The performance of any account or investment strategy managed by OSAM will differ from the hypothetical backtested performance results for each factor shown herein for a number of reasons, including without limitation the following:
- Although OSAM may consider from time to time one or more of the factors noted herein in managing any account, it may not consider all or any of such factors. OSAM may (and will) from time to time consider factors in addition to those noted herein in managing any account.
- OSAM may rebalance an account more frequently or less frequently than annually and at times other than presented herein.
- OSAM may from time to time manage an account by using non-quantitative, subjective investment management methodologies in conjunction with the application of factors.
- The hypothetical backtested performance results assume full investment, whereas an account managed by OSAM may have a positive cash position upon rebalance. Had the hypothetical backtested performance results included a positive cash position, the results would have been different and generally would have been lower.
- The hypothetical backtested performance results for each factor do not reflect any transaction costs of buying and selling securities, investment management fees (including without limitation management fees and performance fees), custody and other costs, or taxes – all of which would be incurred by an investor in any account managed by OSAM. If such costs and fees were reflected, the hypothetical backtested performance results would be lower.
- The hypothetical performance does not reflect the reinvestment of dividends and distributions therefrom, interest, capital gains and withholding taxes.
- Accounts managed by OSAM are subject to additions and redemptions of assets under management, which may positively or negatively affect performance depending generally upon the timing of such events in relation to the market’s direction.
- Simulated returns may be dependent on the market and economic conditions that existed during the period. Future market or economic conditions can adversely affect the returns.