Why U.S. Investors Should Look Beyond Dividend Yield
By Patrick O’ShaughnessyMarch 2012
Many investors are fed up with yields on fixed income securities and are in search of higher yield. As a result, U.S. stocks with high yields have become very popular with individual and professional investors—but we believe that investors are looking at the wrong kind of yield. Though dividend yield works very well internationally, investors in U.S. stocks should instead focus on shareholder yield, a factor we have long advocated that has provided considerably stronger returns for U.S. stocks for more than 80 years.
We believe that the appetite for stocks with high yields is driven by two main factors: first, dividend-paying stocks are perceived as safe (investors tend to view these as more stable companies) relative to other stocks and, second, equity dividend yields are in many cases dwarfing the yields available from fixed income securities in the current low-rate environment. Given that the Federal Open Market Committee (FOMC) has recently extended its forecast of low rates until 2014, the penchant for equity yield is likely to last for some time. However, it’s important to distinguish two forms of yield—dividend and shareholder.
Dividend Yield & Shareholder Yield
Whereas dividend yield is a single factor, shareholder yield is the sum of a company’s dividend yield plus its buyback yield (the percentage of shares outstanding that have been repurchased or issued over the last year). Our research shows that buybacks are very strong buy indicators—while share issuances (primary or secondary offerings) are a bad sign for the stock’s returns in the following year. A current example of a stock with a strong shareholder yield is Lockheed Martin (LMT). LMT has a dividend yield of 4.3 percent and has repurchased 7.2 percent of its shares outstanding over the past year, which results in a shareholder yield of 11.5 percent. As a stock selection factor, shareholder yield is very flexible—it simply favors companies who return cash to their shareholders, regardless of the chosen method. Take DIRECTV (DTV) as an example. While DTV does not pay a regular dividend, it returns a considerable amount of cash to shareholders in the form of a buyback program. We believe that identifying shareholder yield widens the opportunity set for investors.
We have studied dividend yield and shareholder yield back to 1927 in the United States and back to 1970 in international markets and found that both factors work equally well for selecting stocks in international markets but that shareholder yield is far more effective for selecting stocks in the U.S. History suggests that focusing on shareholder yield in U.S.-based strategies can lead to market-beating returns over time.
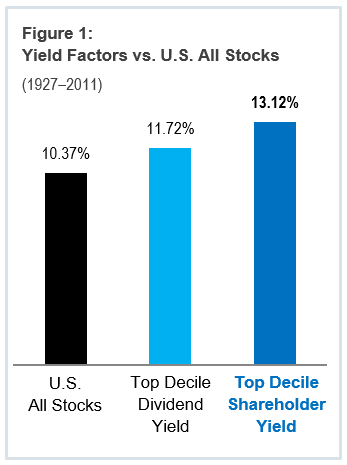
Using data from the Center for Research in Security Prices (CRSP) dating back to 1927, we built decile portfolios (rebalanced annually) for the two yield factors. The annualized return for the top decile of stocks by dividend yield and shareholder yield was 11.72 percent and 13.12 percent, respectively (from 1927 to the end of 2011). During the same time period both of these factors beat the 10.37 percent return of our broad U.S. All Stocks* benchmark, but shareholder yield is the clear winner. We are always most interested in high levels of outperformance, but we also believe strongly that the best factors should beat their benchmarks with high degrees of consistency. As with the returns, stocks with the highest shareholder yields outperform more consistently in all rolling five-year periods, beating the market 88 percent of the time compared to the 68-percent track record for stocks with the highest dividend yield. These long-term results indicate that investors are right to buy U.S. stocks based on their yield—but with a focus on dividends and share repurchases instead of dividends alone. Finally, the Sharpe Ratio for the highest shareholder yield stocks was 0.40 during the period—an improvement over the 0.33 offered by the highest-yielding stocks.
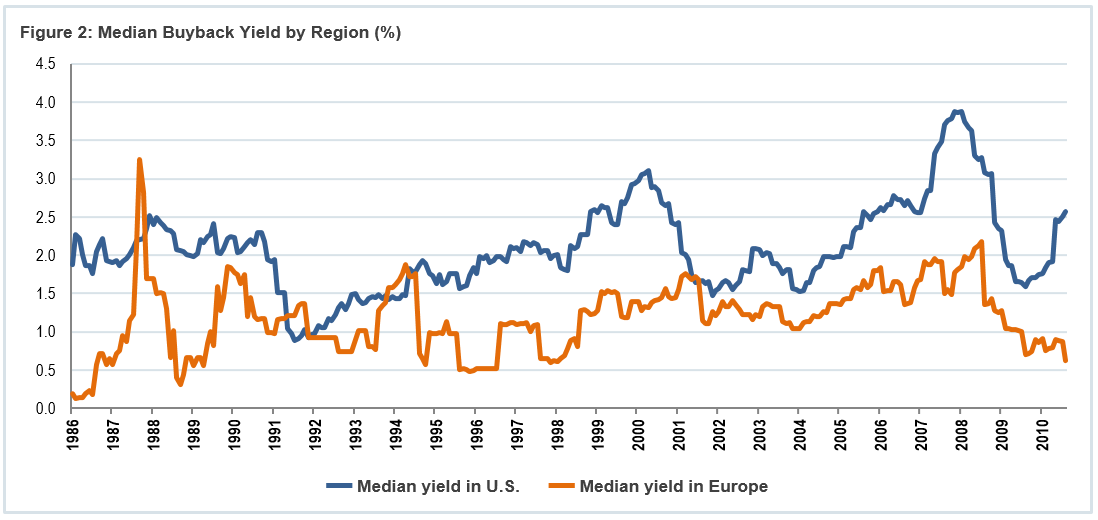
One practical reason to focus on shareholder yield in the U.S. is due to the tendency of U.S. companies to use excess cash to repurchase shares in addition to, or instead of, paying a regular dividend. This trend has been especially pronounced since the 1982 SEC safe harbor rule, which removed many prior restrictions for share buybacks that were in place to prevent market manipulation. As shown in Figure 2 (below), U.S. companies consistently repurchase more shares than their European counterparts who generally tend to favor paying regular dividends. Ultimately, buybacks are a very important tool for returning cash to shareholders. Given the tremendous amount of cash on many corporate balance sheets, it is also likely that significant buyback programs will continue into the future.
Quality Matters
Shareholder yield is clearly a superior method for choosing U.S. stocks. But high-yielding stocks, by this definition alone, are not all equally good investments. There are several key factors—which we collectively refer to as valuation and quality— that are also very important to the selection process. Cheap, high-quality stocks with great shareholder yields are far better investments than those with high yield but questionable valuations or quality. Table 1 (see below) illustrates the advantage of differentiating on the basis of quality and valuation. In each case we have already narrowed the All Stocks universe down to the top 20 percent of stocks by shareholder yield—meaning we start with a high-yield universe. Then we break down these high-yield stocks according to their EBITDA-to-Enterprise Value (value), total accruals (earnings quality), cash flow-to-debt (financial strength), and external financing* (financial strength). In the table below the boxes shaded green represent the annualized return of stocks that are attractive based both on yield and also the factor in question. Conversely, boxes shaded in yellow represent the returns of high-yielding stocks that are otherwise weak.
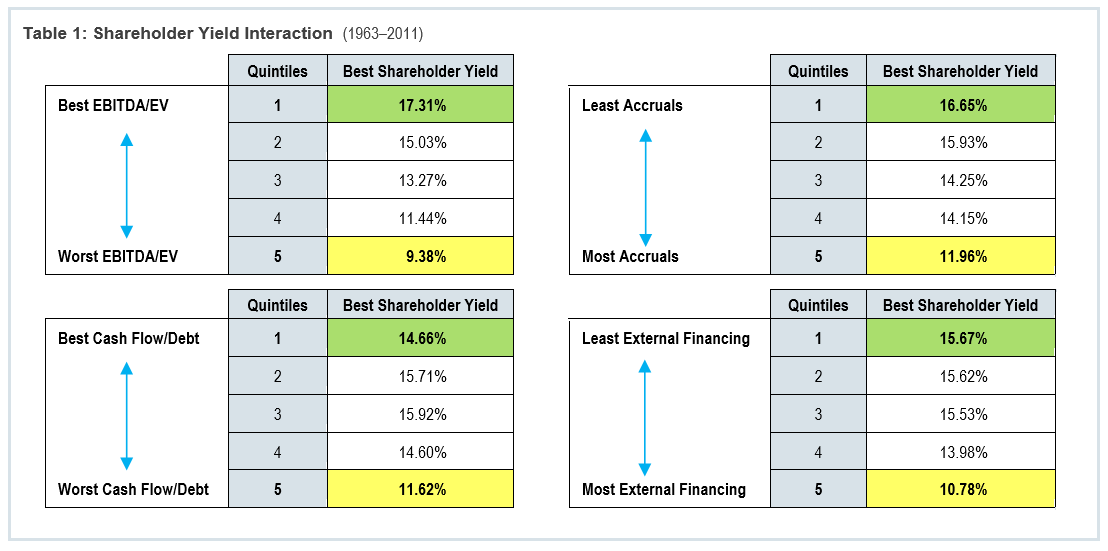
Clearly, there are striking differences in annual return and investors should seek to avoid stocks whose yields may be enticing, but whose quality and price are suspect.
In addition to all of shareholder yield, it is important to note that the dividend yield of a port-folio consisting of high shareholder yield stocks is still impressive when compared with fixed income yields and the yield on broad equity indices. Contrasting with a 10-Year Treasury (yielding 1.96 percent) and the S&P 500 Index (1.96 percent), the O’Shaughnessy Market Leaders Value model portfolio comprised of large, high-quality, cheap stocks with strong shareholder yield has a dividend yield of 3.1 percent (as of 3/7/2012).** In addition to being a driving factor for that strategy, we also use shareholder yield as a component when screening for value across all OSAM strategies. For example, it plays a prominent role in O’Shaughnessy All Cap Core (also known as Diversified Moderate in some channels) and its sister strategies O’Shaughnessy Diversified Aggressive and O’Shaughnessy Diversified Conservative, and O’Shaughnessy All Cap Value as well.
We believe that now is an excellent time to be buyers of stable, market-leading U.S. firms—those firms that are rewarding their shareholders with large cash transfers—at discount prices. We encourage yield-seeking investors to consider more than just dividends alone. Familiar companies like Lockheed Martin, Intel, Travelers, and The Gap are good examples of stocks that meet these criteria at present. By owning these types of stocks, investors can benefit from a yield factor that has proven to be particularly effective throughout lengthy time periods and across a variety of market conditions.
* External financing is the sum of debt and equity issuance over the previous year divided by the average assets of the company over the same period.
** The Dividend Yield is the annual percentage of return earned by an investor on a common or preferred stock. The yield is calculated by dividing the amount of dividends paid per share over the past twelve months by the current market price per share of the stock. OSAM utilizes the services of Factset, a third party data provider vendor, to calculate portfolio characteristics and metrics. The dividend yield is a gross indicated yield. There is no guarantee that the rate of dividend payment will continue and the income derived is subject to taxes and expenses which will impact the actual yield experience of each investor.
General Legal Disclosure/Disclaimer and Backtested Results
The material contained herein is intended as a general market commentary. Opinions expressed herein are solely those of O’Shaughnessy Asset Management, LLC and may differ from those of your broker or investment firm.
Please remember that past performance is no guarantee of future results. Different types of investments involve varying degrees of risk, and there can be no assurance that the future performance of any specific investment, investment strategy, or product made reference to directly or indirectly in this presentation, will be profitable, equal any corresponding indicated historical performance level(s), or be suitable for any portfolio. Gross of fee performance computations are reflected prior to OSAM’s investment advisory fee (as described in OSAM’s written disclosure statement), the application of which will have the effect of decreasing the composite performance results (for example: an advisory fee of 1% compounded over a 10-year period would reduce a 10% return to an 8.9% annual return). Due to various factors, including changing market conditions, the content may no longer be reflective of current opinions or positions. Moreover, you should not assume that any discussion or information contained in this presentation serves as the receipt of, or as a substitute for, individualized investment advice from OSAM. Historical performance results for investment indices and/or categories have been provided for general comparison purposes only, and generally do not reflect the deduction of transaction and/or custodial charges, the deduction of an investment management fee, nor the impact of taxes, the incurrence of which would have the effect of decreasing historical performance results. It should not be assumed that any account holdings would correspond directly to any comparative indices. Account information has been compiled solely by OSAM, has not been independently verified, and does not reflect the impact of taxes on non-qualified accounts. In preparing this presentation, OSAM has relied upon information provided by the account custodian and/or other third party service providers. OSAM is a Registered Investment Adviser with the SEC and a copy of our current written disclosure statement discussing our advisory services and fees remains available for your review upon request.
The risk-free rate used in the calculation of Sortino, Sharpe, and Treynor ratios is 5%, consistently applied across time.
The universe of All Stocks consists of all securities in the Chicago Research in Security Prices (CRSP) dataset or S&P Compustat Database (as noted) with inflation-adjusted market capitalization greater than $200 million as of most recent year-end. The stocks are equally weighted and generally rebalanced annually.
Hypothetical performance results shown on the preceding pages are backtested and do not represent the performance of any account managed by OSAM, but were achieved by means of the retroactive application of each of the previously referenced models, certain aspects of which may have been designed with the benefit of hindsight.
The hypothetical backtested performance does not represent the results of actual trading using client assets nor decision-making during the period and does not and is not intended to indicate the past performance or future performance of any account or investment strategy managed by OSAM. If actual accounts had been managed throughout the period, ongoing research might have resulted in changes to the strategy which might have altered returns. The performance of any account or investment strategy managed by OSAM will differ from the hypothetical backtested performance results for each factor shown herein for a number of reasons, including without limitation the following:
- Although OSAM may consider from time to time one or more of the factors noted herein in managing any account, it may not consider all or any of such factors. OSAM may (and will) from time to time consider factors in addition to those noted herein in managing any account.
- OSAM may rebalance an account more frequently or less frequently than annually and at times other than presented herein.
- OSAM may from time to time manage an account by using non-quantitative, subjective investment management methodologies in conjunction with the application of factors.
- The hypothetical backtested performance results assume full investment, whereas an account managed by OSAM may have a positive cash position upon rebalance. Had the hypothetical backtested performance results included a positive cash position, the results would have been different and generally would have been lower.
- The hypothetical backtested performance results for each factor do not reflect any transaction costs of buying and selling securities, investment management fees (including without limitation management fees and performance fees), custody and other costs, or taxes – all of which would be incurred by an investor in any account managed by OSAM. If such costs and fees were reflected, the hypothetical backtested performance results would be lower.
- The hypothetical performance does not reflect the reinvestment of dividends and distributions therefrom, interest, capital gains and withholding taxes.
- Accounts managed by OSAM are subject to additions and redemptions of assets under management, which may positively or negatively affect performance depending generally upon the timing of such events in relation to the market’s direction.
- Simulated returns may be dependent on the market and economic conditions that existed during the period. Future market or economic conditions can adversely affect the returns.