The Quarterly: Irrational Exuberance Redux
By OSAM Research TeamJanuary 2024
We are pleased to share the latest update in our quarterly commentary series. We have also included links above to our Chief investment Strategist, Ehren Stanhope, webinar and the presentation materials used for that call.
Executive Summary
Major Macro Themes
- There are strong signs of a market regime change in the post-COVID world. Monetary authorities are struggling to contain investors’ exuberance while the burden of higher interest rates is falling squarely on the financial and government sectors.
- Large structural imbalances within the economy, notably housing, need to be sorted out to build a foundation for the next sustainable leg of an equity bull market.
- We believe that fiscal policy matters more in the coming years because of the impact on inflation dynamics and the availability of private capital.
- While coordinated policy response to the GFC pushed investors out on the risk curve, policy actions now suggest an attempt to reign in risk taking to contain potential future inflation.
Implication for Stocks and Bonds
- Asset classes will be competing for scarcer investment capital, as opposed to the abundant capital of the post-GFC period, suggesting intelligent asset class diversification may work better. Equities will continue to be a growth engine that preserves long-term inflation-adjusted earnings power; however, fixed income yields are compelling for the first time in years.
- Higher for longer interest rates suggest that buyback programs may not be as compelling for certain companies. We expect the overall dollar value of buybacks to decline if rates remain high.
- The surge in equity markets in 2023 occurred via three bullish surges and two retracements. The surges featured outperformance by generally, expensive, dilutive, and volatile stocks while the retracements favored stocks with low fundamental volatility and high quality.
- Foreign equity indices lagged for USD investors in 2023, but the inflation-adjusted operational performance in local currencies is compelling, as are valuations.
Allocating Amidst Uncertainty
- Humility is required in 2024. Going into 2023 the average analyst forecast for the return of the S&P 500 Index was negative for the first time since 1999. In 1999 and 2023, the index delivered a 21% and 26% return, respectively.
- Macroeconomic cycles tend to be slow and drawn out, which can make it challenging to see the forest for the trees. Our base case for allocating in the current environment is to start from first principles by owning the market passively, and then layering on overweights and underweights based on conviction and risk tolerance with a multi-year perspective.
- We continue to believe that the next few quarters could be volatile as major issues get sorted out, but that they will present interesting opportunities.
- As we have highlighted in previous updates, the current macro regime likely favors tilts to quality and low volatility.
- We continue to favor Value and Shareholder Yield for active allocations on a longer-term basis as inflation dynamics and a steepening yield curve tend to be supportive of sectors that are overweight within those factors—Industrials, Energy, Materials, Financials.
For more detail, read the full commentary below.

Much ink has been spilled over the decades on topics ranging from diversification, to valuation, to trend following, to flows, and so on. All these frameworks are analytical tools to evaluate a single concept. Financial assets are inextricably linked by some combination of fundamentals (economic profits) and asset flows (allocation decisions). Markets are just a reflection of the underlying demographic, political, geopolitical, and technological drivers of fundamentals and flows.
Our collective task as allocators of client capital is to evaluate the opportunity set and range of possible outcomes that may prevail. This requires a healthy dose of humility as return and risk forecasts cannot be prescriptive. They simply inform how portfolios can be tilted to maximize the probability of meeting client investment objectives.
Over the last several quarters, we have discussed the idea of a regime change, which we call The Great Reversion, that started in November 2021. The characteristics of the new regime—contracting liquidity, persistent inflation, higher interest rates, and deglobalization—have been on full display in 2023. We don’t have any predictions for 2024, but we would like to explore the implications of this regime change for longer-term asset allocation decisions.
Pushing on the Risk Curve
The overarching theme of the post-Global Financial Crisis (GFC)1 era was “There Is No Alternative” (TINA), which is to say that stocks were the only game in town. Fixed income yields were paltry and declining, non-U.S. equities struggled (for U.S. dollar investors), and commodities deflated in the back half of the period.
Even more specifically, mega cap growth-oriented equities were the only game in town. The outperformance of speculative investments reached a fever pitch with the boom in SPACs2, crypto, and meme stocks3 in recent years. Though certainly not in the speculative realm of these categories, we also saw the broad outperformance of venture and private assets that, if publicly traded, would likely fall into the “growth” equity style box given their focus on technology, biotech, and consumer goods.
It now seems obvious (hindsight being 20/20) that a dominant force from 2009 to 2021 was coordinated ample liquidity from global central banks to deal with the deflationary bust of the GFC. The debt overhang took over a decade to unwind, and financial assets benefited tremendously. The period encompassed a strong equity bull markets despite economic growth that was so-so by historical standards. As the saying goes, “the economy is not the stock market”!
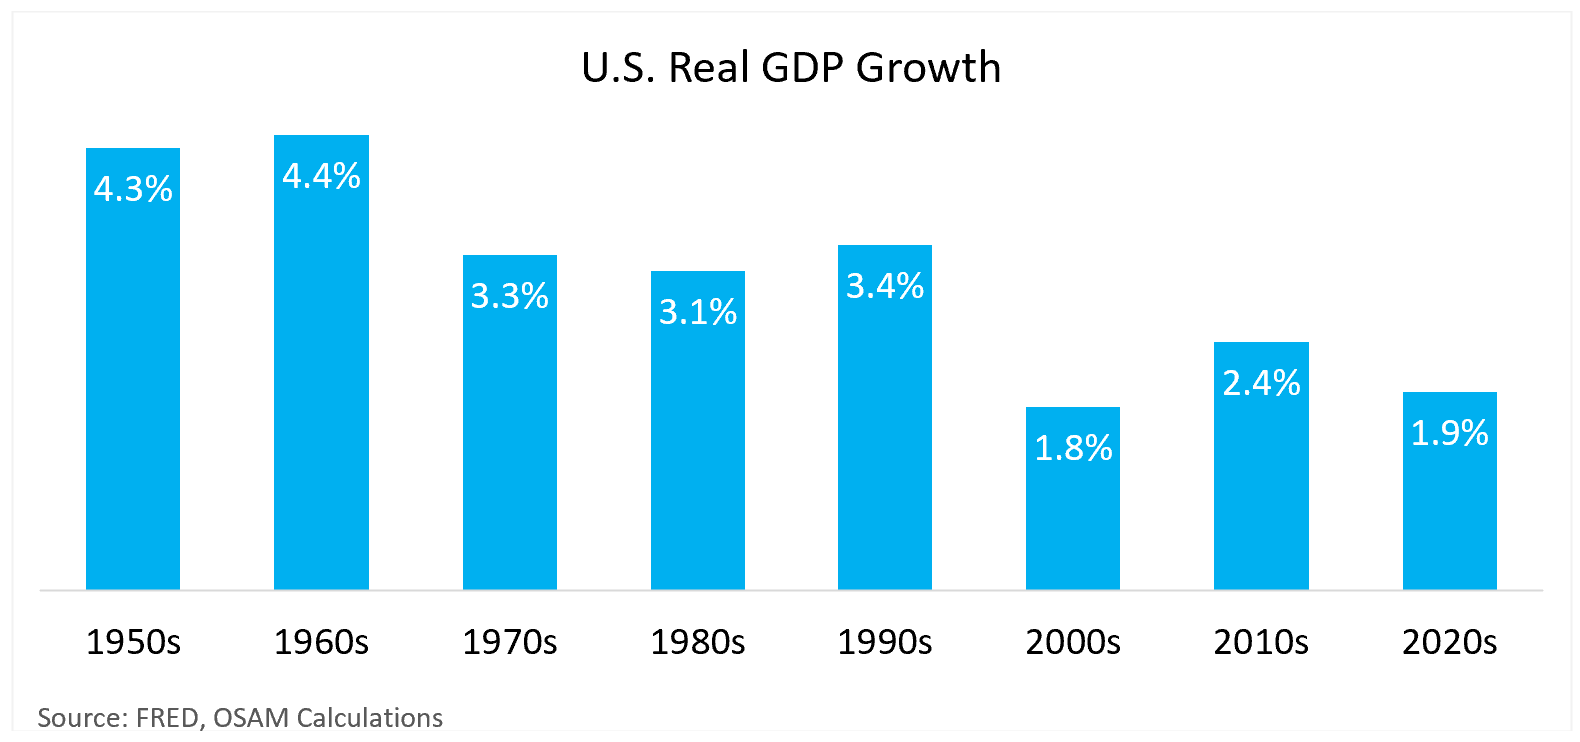
We have highlighted previously that the post-GFC period, culminating with the COVID fiscal and monetary response, represented a massive transfer of debt from the private to the public sector—a stabilizing force that played out about as well as any Keynesian could have dreamed up.
In the long run, however, the distinction between public and private debt is a bit erroneous given that taxpayers ultimately pay for all of it—with the tiny, little, miniscule exception that the public debt is backed by a rather robust printing press, which we have become quite accustomed to using. The Treasury has a few different avenues for reducing the debt beyond that of a private citizen, such as inflation, debasing the currency, or implementing price controls on things like interest rates, housing, wages, or commonly used goods in the economy.4
With interest rates consistently pushing lower throughout the post-GFC period, lawmakers became a bit complacent on the fiscal side of the ledger. This culminated in the reincarnation of Modern Monetary Theory (MMT5), which peaked around mid-2021 and has been summarily eviscerated as a viable path forward in the Monetary-Fiscal tug-of-war of 2023.
Because inflation has been a non-issue since about 2000, lawmakers have had free reign to spend freely with little regard for the inflationary impacts of deficit spending. The FOMC also had the luxury of only focusing on the maximum employment component of their dual mandate.
That alignment of fiscal and monetary policy is not historically “normal” in our view. The forces of monetary and fiscal policy operate much like ocean tides with the gravitational forces of the moon and sun causing the ebb and flow of the water levels across the globe. The post-GFC period might as well have been the two giant celestial bodies moving in unison, the financial equivalent of day and night at the same time.
The result was that investors were being pushed out on the risk curve because…TINA. This kept financial conditions consistently loose at a time when the disinflationary forces of technology, demographics, and decelerating global growth drove consistent inflation undershoots. The major central banks conducted strategic policy reviews which resulted in “symmetrical” inflation targets that effectively gave them cover to allow inflation to run hot.
The last two years have flipped the FOMC’s calculus on its head. The strength of the labor market forced the FOMC6 to solely focus on the inflation aspect of their mandate. Therefore, the Monetary-Fiscal tug-of-war is a concept that suggests the actions of the FOMC and U.S. fiscal authorities will likely be at odds with each other over the coming years given their competing aims.
Monetary authorities are clearly encouraging investors to reduce risk. The logic for this is intuitive. The FOMC telegraphed multiple times, most recently on November 9th and December 1st, that financial conditions need to tighten to lower aggregate demand. On December 13th, the market interpreted a reference to FOMC member rate cut projections as suggesting that a rate cutting cycle is imminent. That may turn out to be true, but it would be quite an about-face from comments just two weeks prior.
The problem is that the Fed has no direct, immediate influence on consumption or investor portfolios. Only through financial conditions can their aims be achieved on a long lag, and financial conditions tend to be negatively correlated with payrolls and the stock market. Comments on “aggregate demand” are a backdoor way of saying that unemployment needs to rise, and investors need to become less “irrationally exuberant”. That’s not a great prognosis for anyone, but as the popular adage goes, “don’t fight the Fed”.
Fighting the Fed is exactly what the equity market had been doing all year and doubled down on in November and December. Financial conditions have eased to the level they were before the FOMC began tightening in early 2022, despite 5.5% of rate hikes and $1.2 trillion in balance sheet shrinkage!
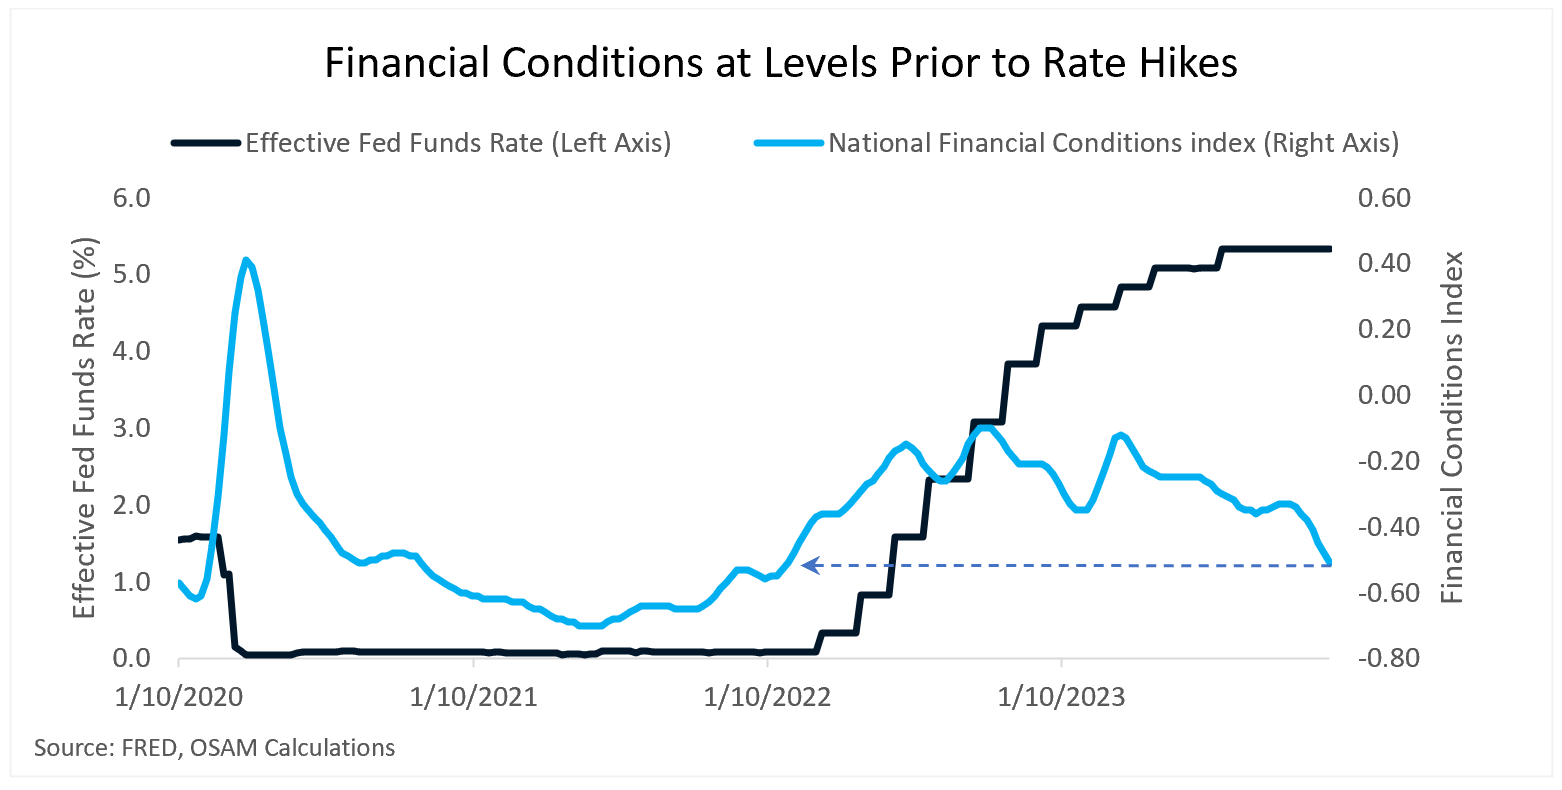
From the perspective of inflation risk, this chart is troubling because it could underpin a rise in inflation in 2024. The Goldman Sachs Financial Conditions Index equated this decline in conditions to a 90 bps cut in the Federal Funds rate7, which grew wider in the days following the December FOMC meeting.
As a result of this chain of events over the last two years, investors now have many alternatives and there is a decent chance that financial asset returns will reflect this new trend in the coming years. Asset classes will be competing for scarcer investment capital, as opposed to the post-GFC period which featured abundant investment capital.
When we look to the labor market, there are no signs of retrenchment or recession. Employment is secularly tight, but loosening ever so gradually whether you look at high frequency initial and continuing claims, Challenger job cuts, the JOLTS8 survey, wages, or Non-Farm Payrolls. This unusual strength has spurred many to discuss a soft landing, which is very much supported in the current data. That can obviously change, but it is likely a key contributor to the strength underpinning the surprising bull market of 2023.
An Unprecedented Crossroads
If monetary policy is transmitted through financial conditions, and conditions are ultra-loose despite nearly two years (!) of tightening, one must ask the question, “who is bearing the burden of higher rates right now?” Though not quite as explicit, we touched on this in last quarter’s commentary, but think it’s important in understanding the quixotic current market backdrop that has perplexed all of us.
Let’s address each of the four sectors of the economy: households, nonfinancial corporates, financials, and the government.
Households: Counterbalancing the nearly 30% increase in goods inflation, households have enjoyed robust wage growth and a surge in net worth—mostly due to real estate appreciation—since the fourth quarter of 2019. Absent a rise in the unemployment rate, it seems unlikely that households will be a source of weakness. The seized up existing housing market is a key economic imbalance that will be important to resolve as it represents the capital base from which credit and spending is dependent. With real estate prices elevated, wages rising, and employment strong, consumer resilience could continue to defy the naysayers.
Nonfinancial corporates: The increase in interest rates has not yet substantively impacted profit margins for most public corporations. If interest rates were to remain steady until 2030, we estimate the additional burden due to refinancing of maturing debt to be a meager 1.0% drag on earnings-per-share (EPS) for the S&P 500.9 The more substantive impact, which is already in process, is the 1.7% drag on EPS from increased cost-of-goods sold (COGS) since the beginning of 2021. While profit margins could continue to moderate, they remain near all-time highs as sales continue to grow nominally year-over-year at about 4.7%, as of late November. A strong consumer, representing 70% of the economy, could continue to buttress corporate earnings and economic strength.
Financials: Banks continue to be in a difficult spot as yields remain stubbornly high. Many banks face unrealized losses in their held-to-maturity portfolios, which surged in the third quarter. Absent the Bank Term Funding Program (BTFP), which allows banks to post depreciated Treasury securities as collateral at par, it seems unrealistic the banking system would not be significantly struggling. The program currently has $135.8 Billion in use and has continued to grow since the summer.10
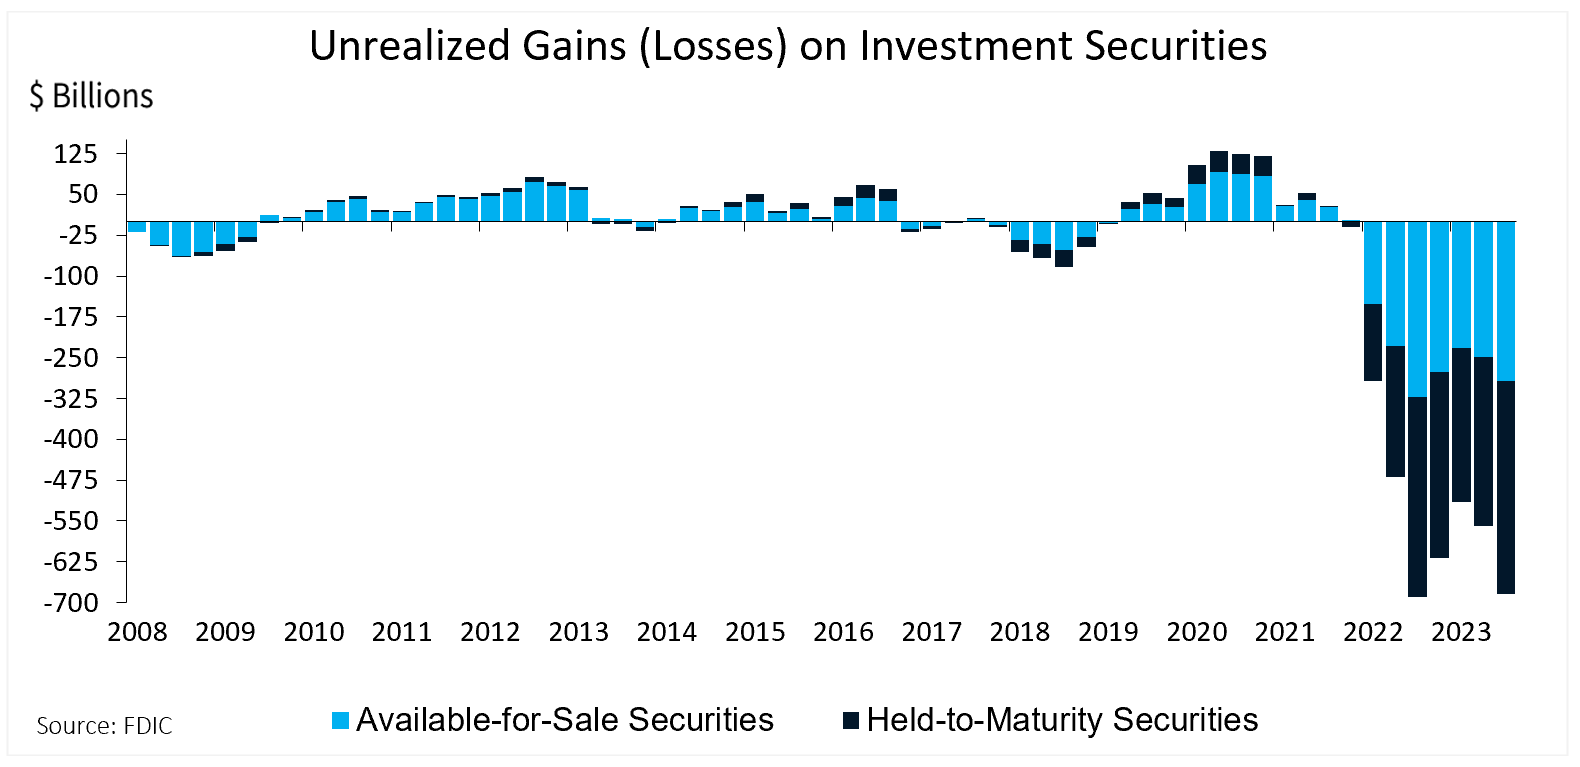
Financials, specifically banks, are very much bearing the burden of higher rates through the impairment (realized and unrealized) of their asset books and the slowdown in demand for credit. As of the third quarter, the FDIC reported total losses on bank balance sheets at $684 billion (see chart above), which is just a stone’s throw away from the $689 billion reported in the third quarter of 2022 that precipitated the recent banking crisis. If the BTFP program remains in place, which it almost surely will, this imbalance appears to be manageable.
That said, if interest rates were to remain elevated on a go forward basis, we do estimate the impact on bank EPS from higher debt refinancing costs would be around a 1.5% annualized drag on the sector through 2030, which translates to an approximate -0.2% annualized headwind for S&P 500 Index EPS.11
A critical aspect to monitor over the next few years, which could cause credit losses in addition to our estimates, will be exposure to areas of the real estate market that have been transformed by the pandemic and are likely to experience defaults, namely the office sector. This could be a further drag on bank earnings beyond our estimates above as they reserve against losses.
Government: Following the COVID-era stimulus, the government sector has fully absorbed the reduction in debt (relative to GDP) from the Household and Financial sectors following the GFC. With interest rates now much higher, the fiscal situation is challenged as the government sector digests the residual cost of the pandemic stimulus.
The total stock of public and private debt currently sits at about 350% of GDP. With interest rates hovering near 0%, the level of debt was functionally irrelevant. With the level of debt and interest costs now substantially higher, deficits do matter.
Lacey Hunt of Hoisington Asset Management, the renowned economist and Treasury sector investor, points out that we have just eclipsed the third straight quarter of negative net national saving.
Net National Saving = Domestic Investment + Net Exports
Outside of the GFC and pandemic shock, this circumstance had not occurred since at least the late 1940s. The current culprit is the cost of the public debt, which is now clocking in at a $981 billion per year pace.12 The fear is that net negative savings imply the U.S. is unable to replenish the capital stock required for future economic production or it is reliant on foreign capital to do so.
At a time when many market participants are banking on an AI-fueled productivity boom, a crowding out of domestic investment is the last thing the domestic (or global) economy needs. Further, reliance on foreign sources of capital at a time when geopolitical hot spots are cropping up each year doesn’t seem like a particularly prudent path either.
We continue to believe that fiscal matters will matter more in the coming years than they have over the previous few because they will have an impact on inflation dynamics and the availability of private capital. Look for esoteric themes like Treasury auctions, term premiums, and Quarterly Refunding Announcements to take on greater prominence, and potentially the return of the Bond Vigilantes.13
Implication for Stocks and Bonds
Equities have historically been the growth engine in investor allocations that has preserved long-term inflation-adjusted earnings power. Despite all the doom and gloom above, nothing here is to suggest that stocks don’t continue to hold a critical place in long-term investor allocations.
As 2023 has demonstrated, timing markets is incredibly difficult, and outcomes are not always aligned with intuition. Given the knowledge on January 1 that a banking crisis would ensue within a few months, few could have found justification to be bullish. However, the current situation does imply that investors may need to dust off the diversification handbook to guard against prevailing risks. Despite the euphoria surrounding the FOMC’s perceived “pivot” in December, some indigestion is possible over the coming quarters as structural imbalances work themselves out.
With three-month Treasury bills offering 5.4%, an S&P 500 Index equity earnings yield of 4.5% seems paltry in comparison. With tremendous relative within-holding-period volatility, the bar for risky assets like equities is undoubtedly higher than it was just one year ago. This imbalance has implications for everything from personal portfolio allocations to whether or not CFOs hit “go” on share buyback programs.
From an objective standpoint, it seems likely that we are still in a drawn-out structural bear market. That might seem quite strange given that equity markets are approaching all-time highs, but it should be noted that the S&P 500 Index has been on a circuitous round-trip path to nowhere for the last two years. This is not an uncommon occurrence as there are many prolonged periods of sideways consolidation in markets historically, sometimes for many years as imbalances work themselves out.
Below are some of the key historical indicators14 of a structural bear market, which seem to be met currently:
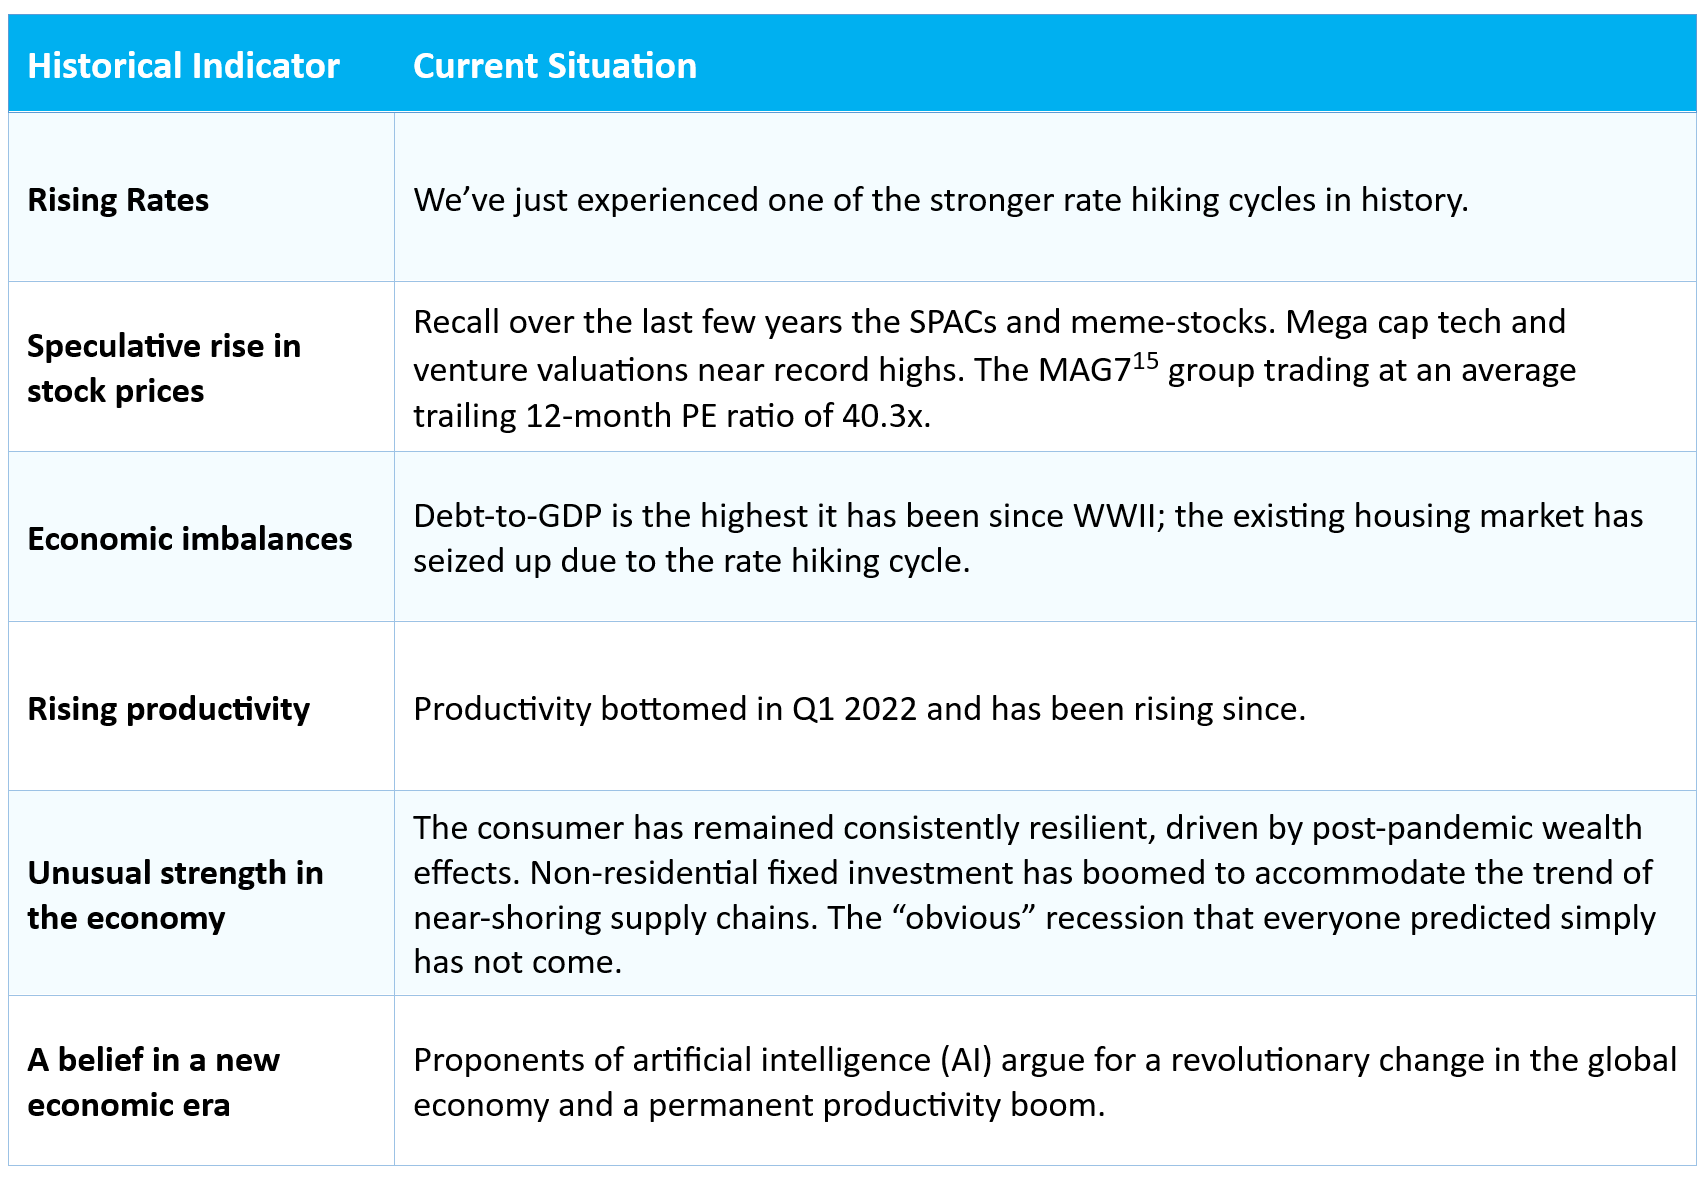
At the least, valuations across asset classes likely need to normalize. Whether that infers the coming rate cutting cycle, a contraction of stock market valuation multiples, or some combination is a topic of much debate. Markets can correct over time as fundamentals catch up to valuations, or via price declines. We don’t have a dog in that fight, but we can look at a few scenarios for stock and bond markets.
Bull case: Inflation continues to moderate towards the FOMC’s 2% target while the labor market loosens but remains robust. Consumption and investment weaken towards the FOMC’s 2% target and in fact undershoot for a period. A gradual slackening of aggregate demand gives the Fed cover to execute their plan to cut rates gradually so that inflation-adjusted policy rates do not become restrictive. Yields at the short end of the yield curve gradually decline while long-end rates remain well anchored as forward inflation expectations decrease. A decline in rates allows the existing housing market to “clear” without a large decrease in housing prices as mortgage rates decline, and transaction volumes increase. Current consensus analyst expectations for a 13.6% increase in 2024 S&P 500 earnings16 come to fruition and the increase in productivity in the data turns out to be legitimate. Geopolitical tensions moderate, which reduces war-related, inflation-inducing deficit spending. This scenario would most likely be positive for stocks and bonds. Within equities, riskier corners of the market would likely benefit—high valuation, lower in market cap, down in quality.
Inflationary Bear case: Employment, consumption, and investment remain stubbornly above Fed target while wages continue to push higher. Inflation expectations remain elevated, mostly driven by elevated energy, shelter, and food costs. The higher-for-longer narrative reignites as inflation data surprise to the upside early in the year. Rates at the long end of the yield curve rise as inflation expectations shift higher. Transaction volumes in the housing market remain depressed. Corporations reach the Rubicon beyond which they are no longer able to pass along price increases to consumers digesting the 30% rise in costs over the last few years.17 Corporate margins get squeezed by the wage-price spiral and analysts need to lower earnings expectations for 2024. The U.S. becomes further drawn into geopolitical conflict, requiring additional fiscal spend that exacerbates existing deficits. In such a case, bonds and stocks would both be under pressure. The Fed would be unable to lower policy rates as is currently anticipated in Fed Funds futures markets.18 This eventuality would be negative for stocks and bonds. Within equities, we would expect high quality resilient businesses with stable fundamentals and priced at a discount to outperform.
Deflationary Bear case: Underlying slack develops rapidly in the labor market and the recent increases in productivity turn out to be driven by a reduction in hours worked, ultimately resulting in a surge in unemployment that undermines housing prices, investment, and consumption. Asset prices would move to reflect increases in defaults and the potential for credit events would increase. The housing market could be susceptible to price declines if defaults increase. A deflationary bear market is likely the most positive scenario for bond investors as it would cause the Fed to rapidly cut rates at the short end of the yield curve while long end rates would also decline as growth and inflation expectations fall. It’s likely the most unfavorable scenario for stocks given that the characteristics of this scenario are more systemic in nature.
Our best guess is that the next year includes a few ingredients from each of the scenarios above, which will create an interesting cocktail of opportunities for smart investors. Inflation dynamics will most likely be the pivot point on which aspects of the scenarios may come to fruition. Unfortunately, the data is quite murky because some aspects of inflation are in outright deflation (Durable Goods, -2.2% and Energy, -4.8%) while others are still rising above the FOMC’s target (Services, +4.4%) on a year over year basis.19 Surges in energy costs or a weakening of the U.S. dollar could reignite the inflation fire.
Another separate, but related, wildcard that should certainly not be forgotten is that 2024 is an election year in the U.S. No political candidate worth their salt wants economic weakness heading into a re-election campaign so expect inflation fighting rhetoric to be balanced with growth-supportive fiscal policies—including Treasury actions. A quick survey of elections since the 1940s reveals that all four of the elections which coincided with a recession in the same year resulted in a party change in the White House.
A Few Thoughts on Factors, Fundamentals, and FX
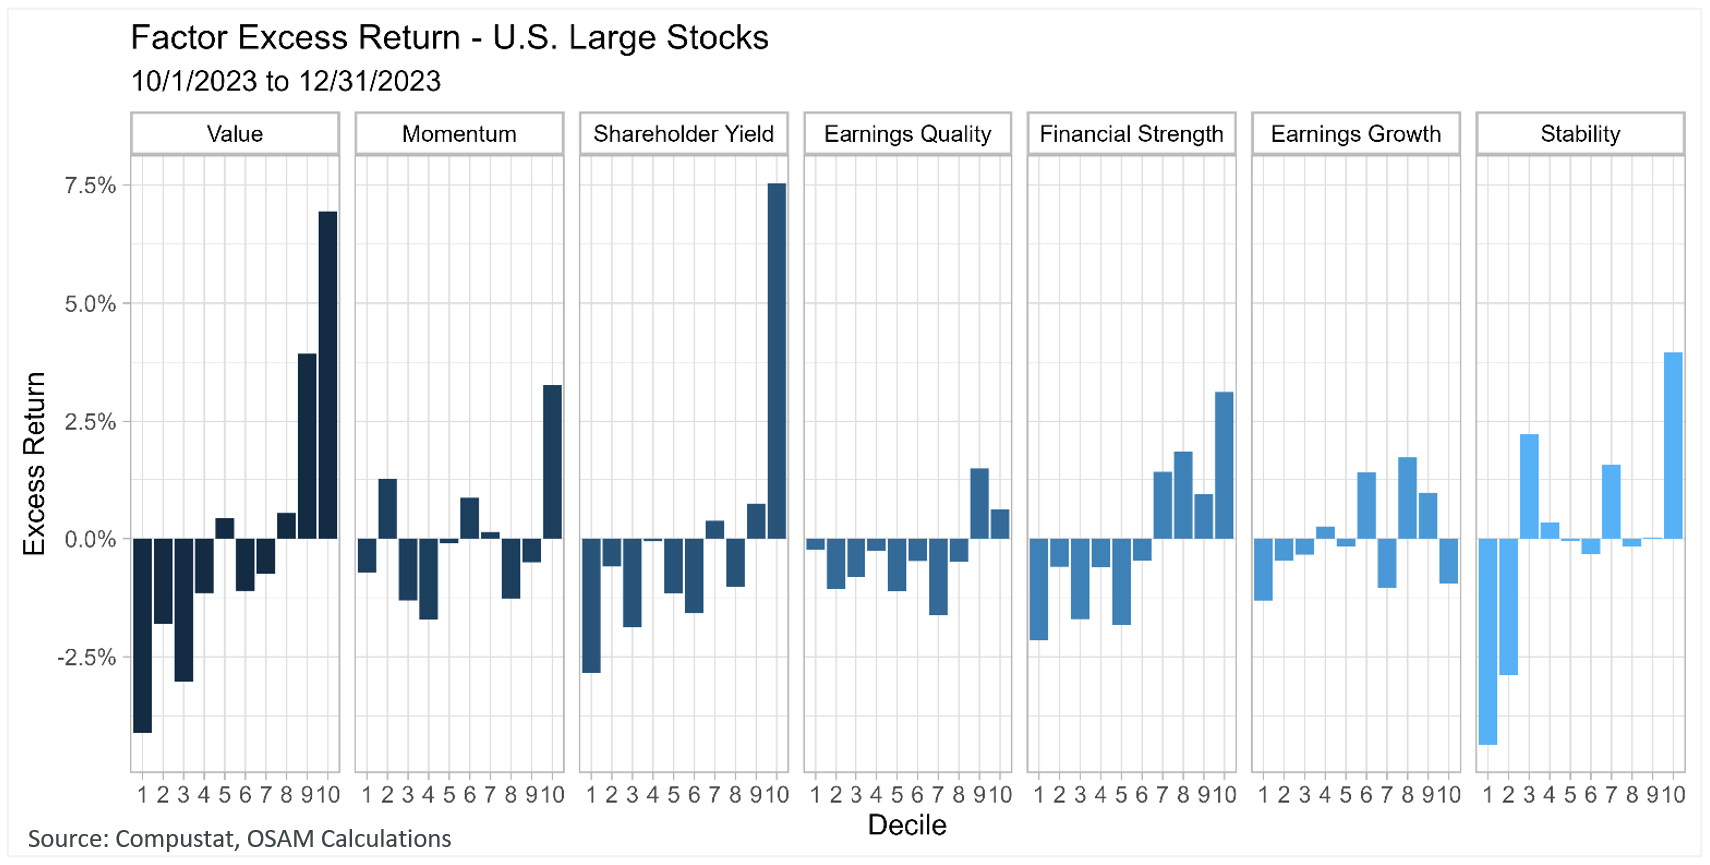
Equity markets ended 2023 significantly higher, but not without fanfare. The S&P 500 surged in the last two months of the year ending approximately 25% higher. Global markets went through five regimes—spurred by banking crises, monetary decisions, and geopolitical conflict. The charts below display the factor themes that generated outperformance in each regime.
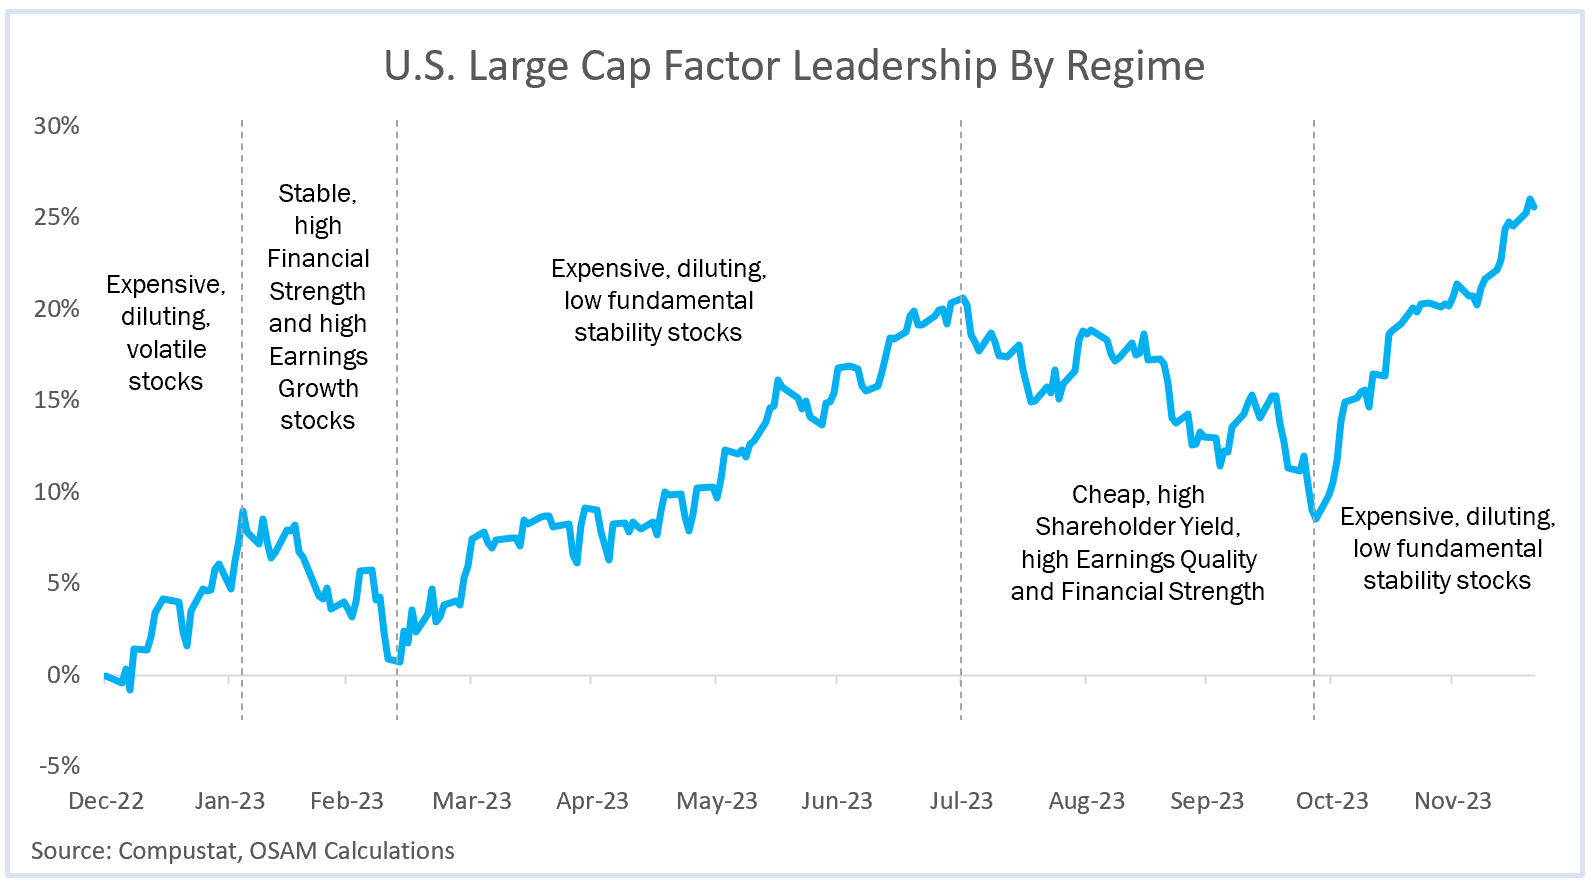
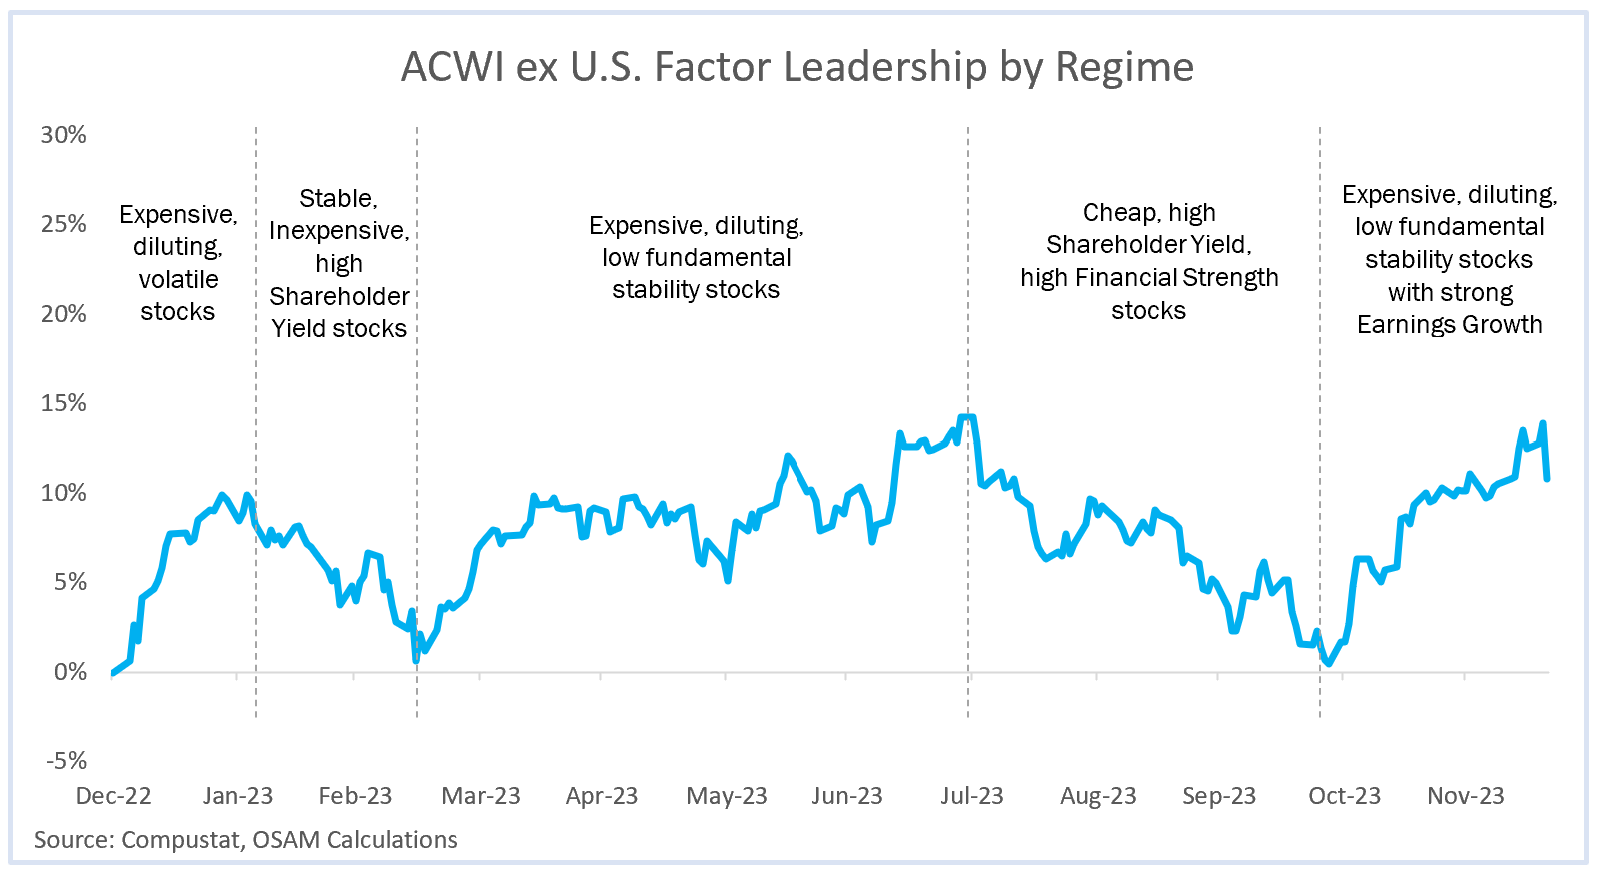
In three of the regimes, expensive stocks that dilute shareholders through share issuance with volatile underlying fundamentals outperformed. These were generally “risk on” periods. The remaining two regimes, which were “risk off” periods where markets experienced drawdowns, featured outperformance from higher quality names with stable fundamentals and having a value bias.
Value stocks outperforming in drawdown periods has been a notable feature of the current post-COVID regime. Prior to the bear market of 2022, value stocks had generally not outperformed in drawdowns since the tech bubble burst.
Though U.S. mega cap stocks continue to be in the driver’s seat, there may be potential shifts in investor behavior that are worth considering. The most obvious of which is the significantly greater appeal of bonds than at any point over the last few years given prevailing yields. Within the equity market, a few themes may emerge that dovetail with the outcome of the global interest rate regime.
Return of Capital
Dividends and buybacks are key components of long-run shareholder returns. Though most investors are familiar with the importance of dividend reinvestment, buybacks get short shrift. Buybacks have grown in popularity (primarily in the U.S.) since the early 1980s. The chart below shows the steady growth in dividends over time as juxtaposed to the cyclical swings in net buyback activity. Gross buybacks amounted to nearly $1 trillion in 2022 but are tracking about 20% lower for 2023.
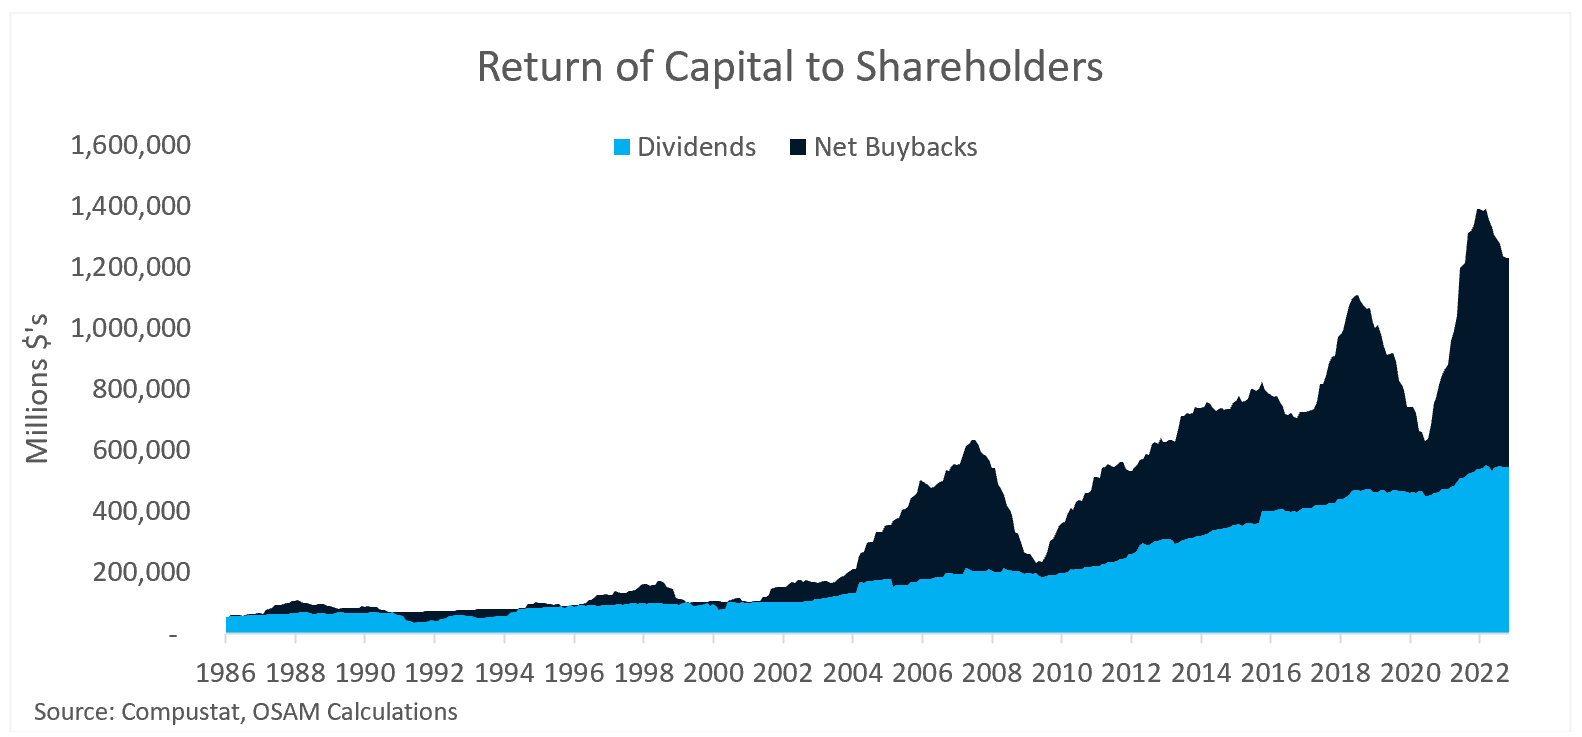
Given the interest rate environment, we think that a decline in buyback executions is logical behavior. In Buyback Bulls and Bears, our Chief Investment Officer, Chris Meredith, pointed out that when a stock’s earnings yield20 is higher than the prevailing return on cash, repurchases are a beneficial boost to earnings per share (EPS). When the return on cash is higher than the earnings yield, EPS is decreased through share repurchases.21 In other words, when cash yields are high, it may be prudent to hold onto that cash and collect interest rather than repurchase stock.
In a recent piece, Michael Mauboussin comes at buybacks from another angle by pointing out that the economics of buybacks could be impacted by higher debt costs.22 Specifically, when the earnings yield on a stock is higher than the after-tax yield on debt, buybacks are generally beneficial to EPS. When the after-tax yield on debt is higher than the earnings yield, it theoretically destroys shareholder value.
The chart below shows the percentage of companies with earnings yield greater than the 3-month Treasury bill and greater than the after-tax cost of debt, respectively.
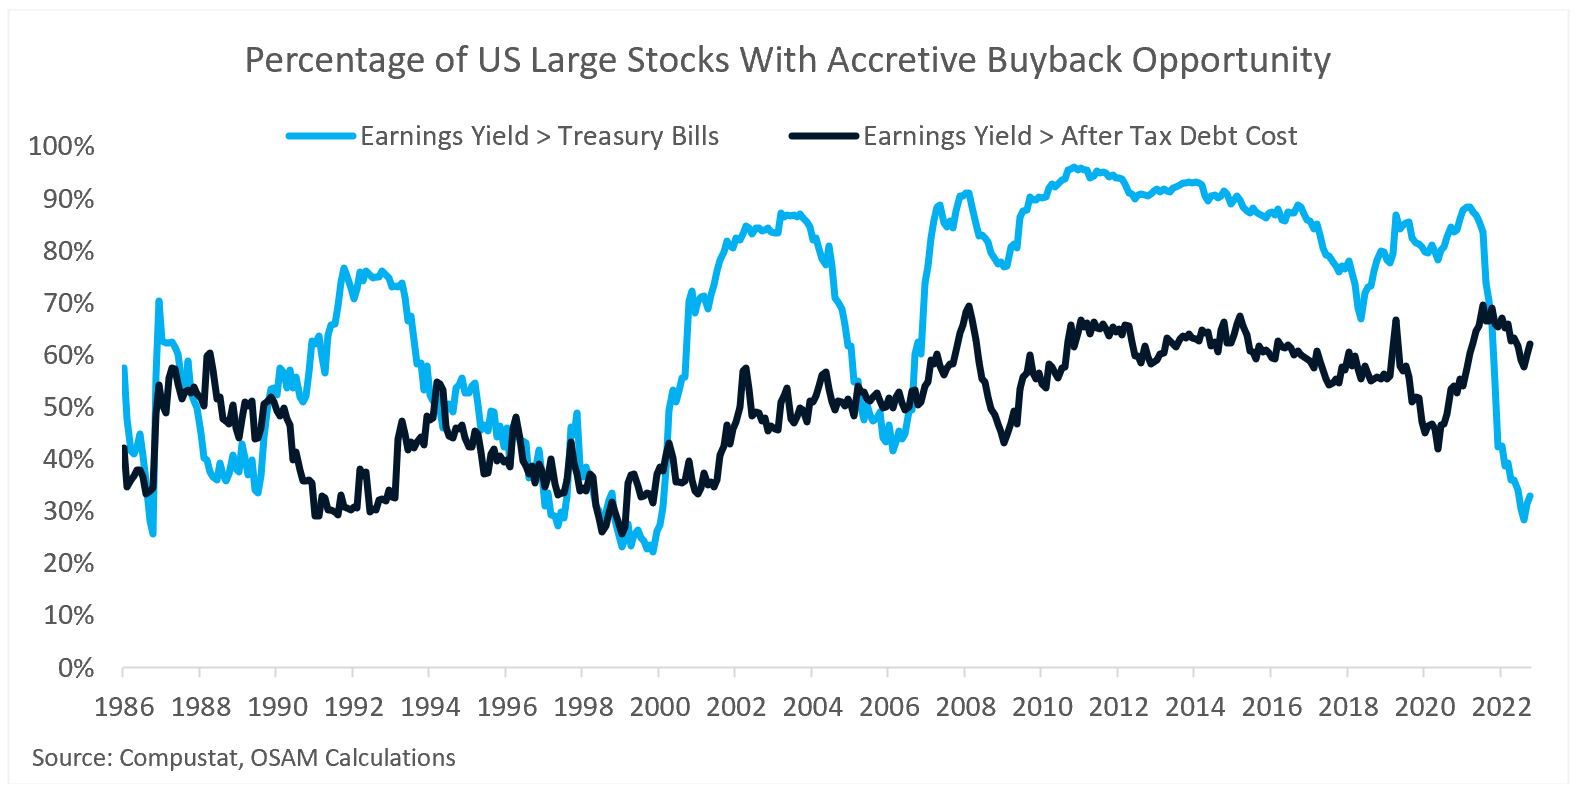
Given the FOMC’s rate hiking cycle and stubbornly high equity valuations, the universe of stocks with earnings yields higher than 3-month Treasury bills has shrunk from 87% in April 2022 to 33% as of the end of the third quarter. That suggests the universe of companies who might benefit from buybacks could remain depressed unless interest rates or equity valuations revert lower.
That’s not necessarily a bad thing for investors who favor high Shareholder Yield. Historically, there tends to be a negative correlation between market-level buyback activity and positive excess return from high Shareholder Yield stocks. However, corporate buyback activity is a large structural flow that supports markets. A decline in that flow on a sustained basis could be suggestive of greater broad equity market volatility moving forward.
Non-U.S. Fundamentals and Foreign Exchange
For yet another year, non-U.S. markets have lagged. While it might be easy to assume that non-U.S. markets are just “broken”, we would be remiss not to point out that fundamentally, they are doing quite well. The devil is almost always in the details and recently that devil has been inflation and currency effects for U.S. domiciled investors.
To compare fundamentals, we evaluated Developed and Emerging Market stocks on a real local currency basis, which reflects the inflation-adjusted return for a local investor in that market. When you do so, you find that U.S. sales, cash flows, earnings, and dividends have lagged their foreign counterparts since the new market regime started in later 2021.23

Three things have caused U.S. investors to not benefit from these fundamental advantages: currency moves, inflation dynamics, and valuation multiple compression. We estimate the return drag from these components to be -13.3% for Developed Markets and -8.1% for Emerging Markets since December 2021.
If one could make the case that non-U.S. fundamentals will continue to outperform, their valuation multiples are done contracting, and U.S. dollar strength may be waning, it could be a powerful case for non-U.S. allocations.
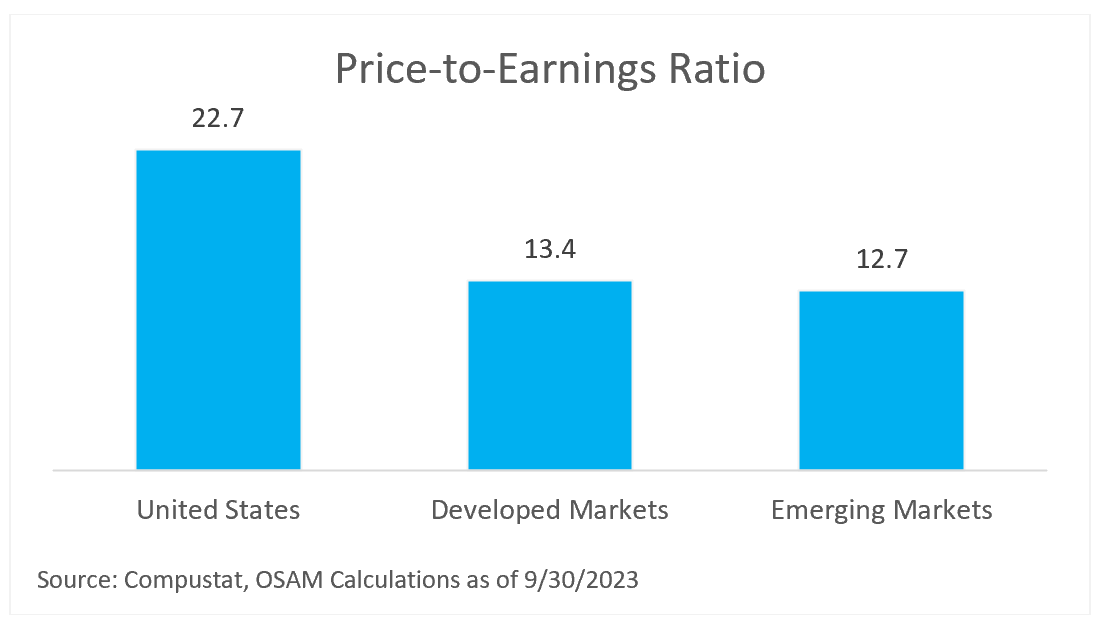
Developed and Emerging Markets have underperformed for a long period of time and many an allocator has been frustrated by the trend’s persistence. The valuation discounts are quite large, but there’s no crystal ball that can tell us when that performance clock will strike midnight.
Because geographic performance cycles tend to be long-tenured in nature, we don’t think there is an issue with a wait and see approach. When the tide turns, it will likely last multiple years, so missing out on the first one likely won’t be detrimental to long-run investor returns.
Allocating Amidst Uncertainty
As is generally the case, the opportunity set and range of possible outcomes that may prevail in the coming years is wide. Even in times when we may feel “certain” of an outcome, a healthy dose of humility is required—all return forecasts and price targets must be handled with care. Case in point, going into 2023 the average analyst forecast for the return of the S&P 500 Index was negative for the first time since 1999. In 1999 and 2023, the index delivered a 21% and 26% return, respectively. Is it possible that those negative forecasts could have come to fruition? Certainly, but they didn’t! When used properly, forecasts simply inform how portfolios can be tilted to maximize the probability of meeting client investment objectives.
Macroeconomic cycles tend to be slow and drawn out, which can make it challenging to see the forest for the trees. Those analysts making forecasts for 1999 actually had it right; they were just one year early as the S&P 500 went on to deliver three consecutive negative calendar year returns.
Our base case when asked how to allocate in the current environment is to start from first principles by owning the market passively, and then layering on overweights and underweights based on conviction and risk tolerance with a multi-year perspective. We continue to believe that the next few quarters could be volatile as major issues get sorted out, but that they will present interesting opportunities.
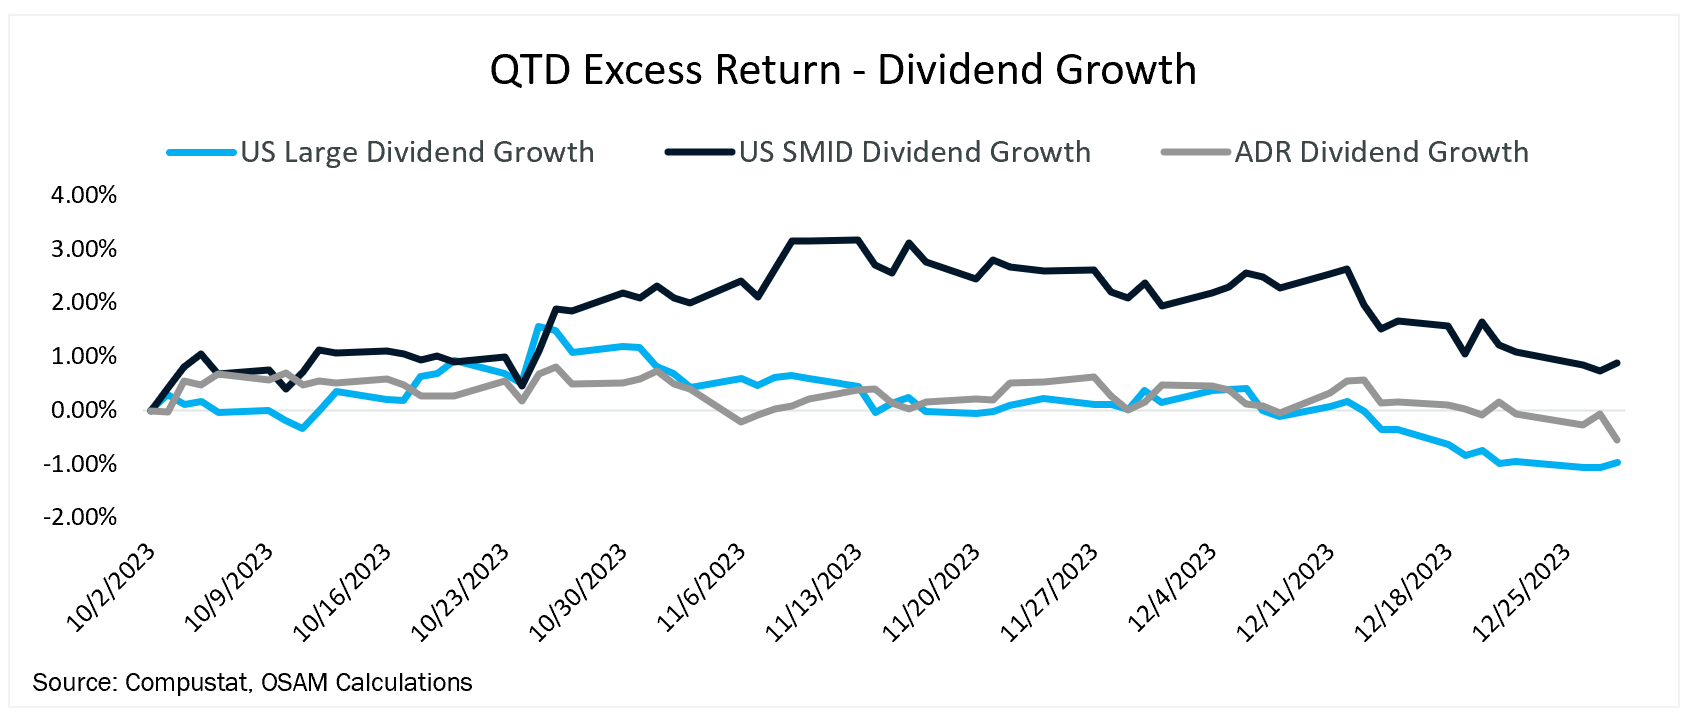
For some investors that may result in tilts to small cap, quality, shareholder yield, or non-U.S. stocks. For some, it may be the reliance on companies generating supernormal year upon year dividend growth. For others, it may mean equity market exposure with significant downside protection through companies exhibiting low fundamental volatility. And for some, it may simply be gaining low-cost passive exposure while harvesting for tax losses. We firmly believe, and our research empirically demonstrates, that these strategies each have a reasonably high likelihood of delivering on their stated objectives over time.
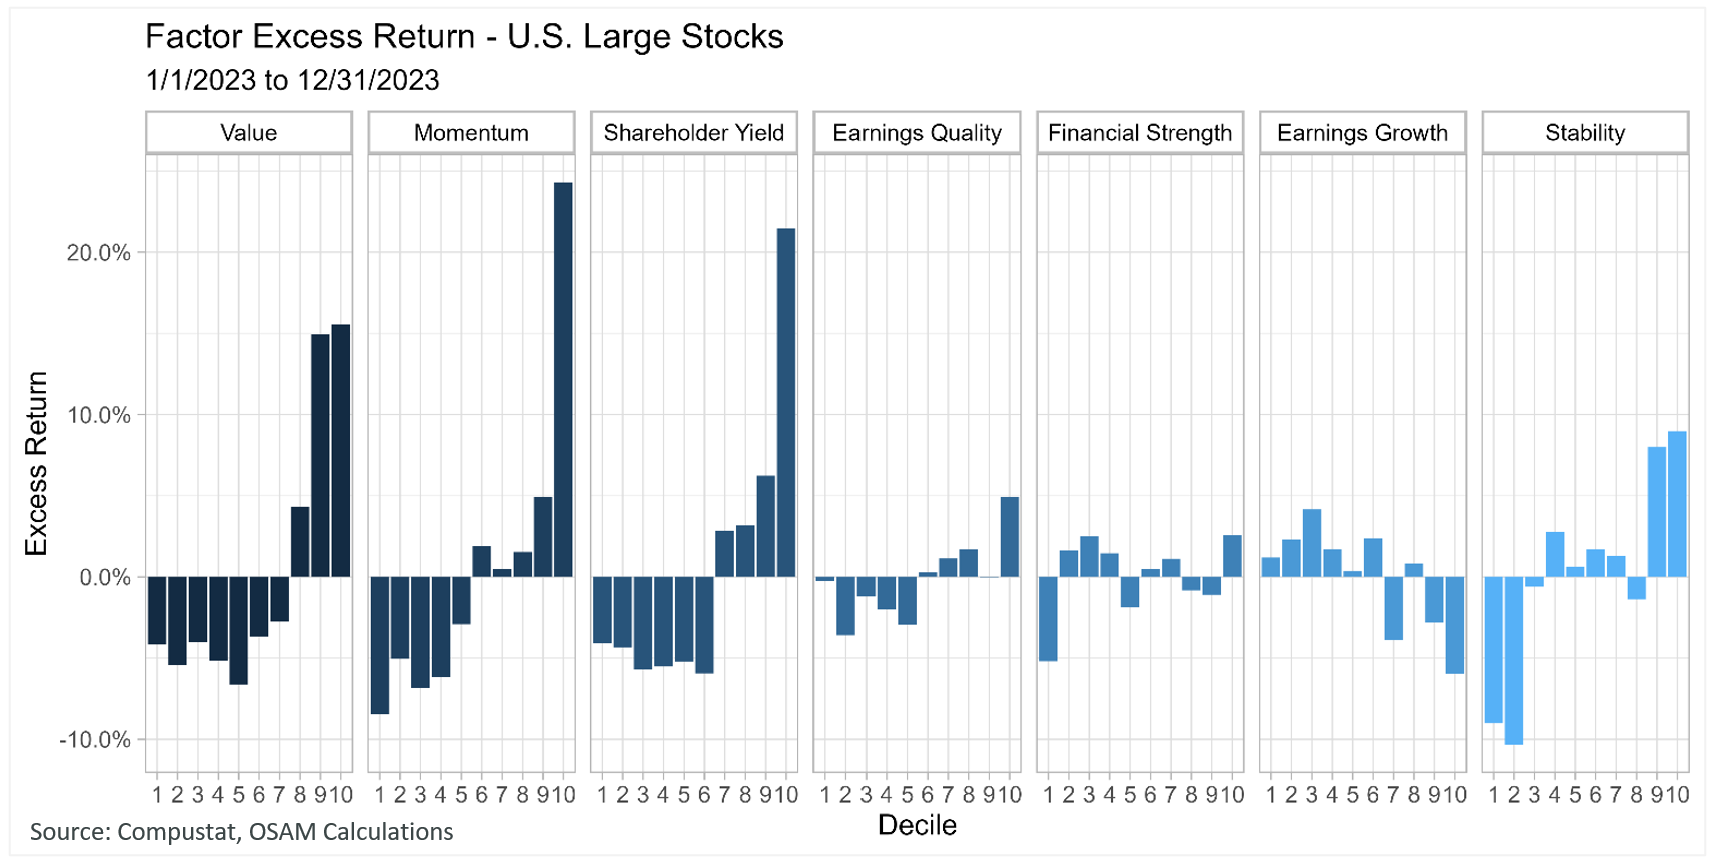
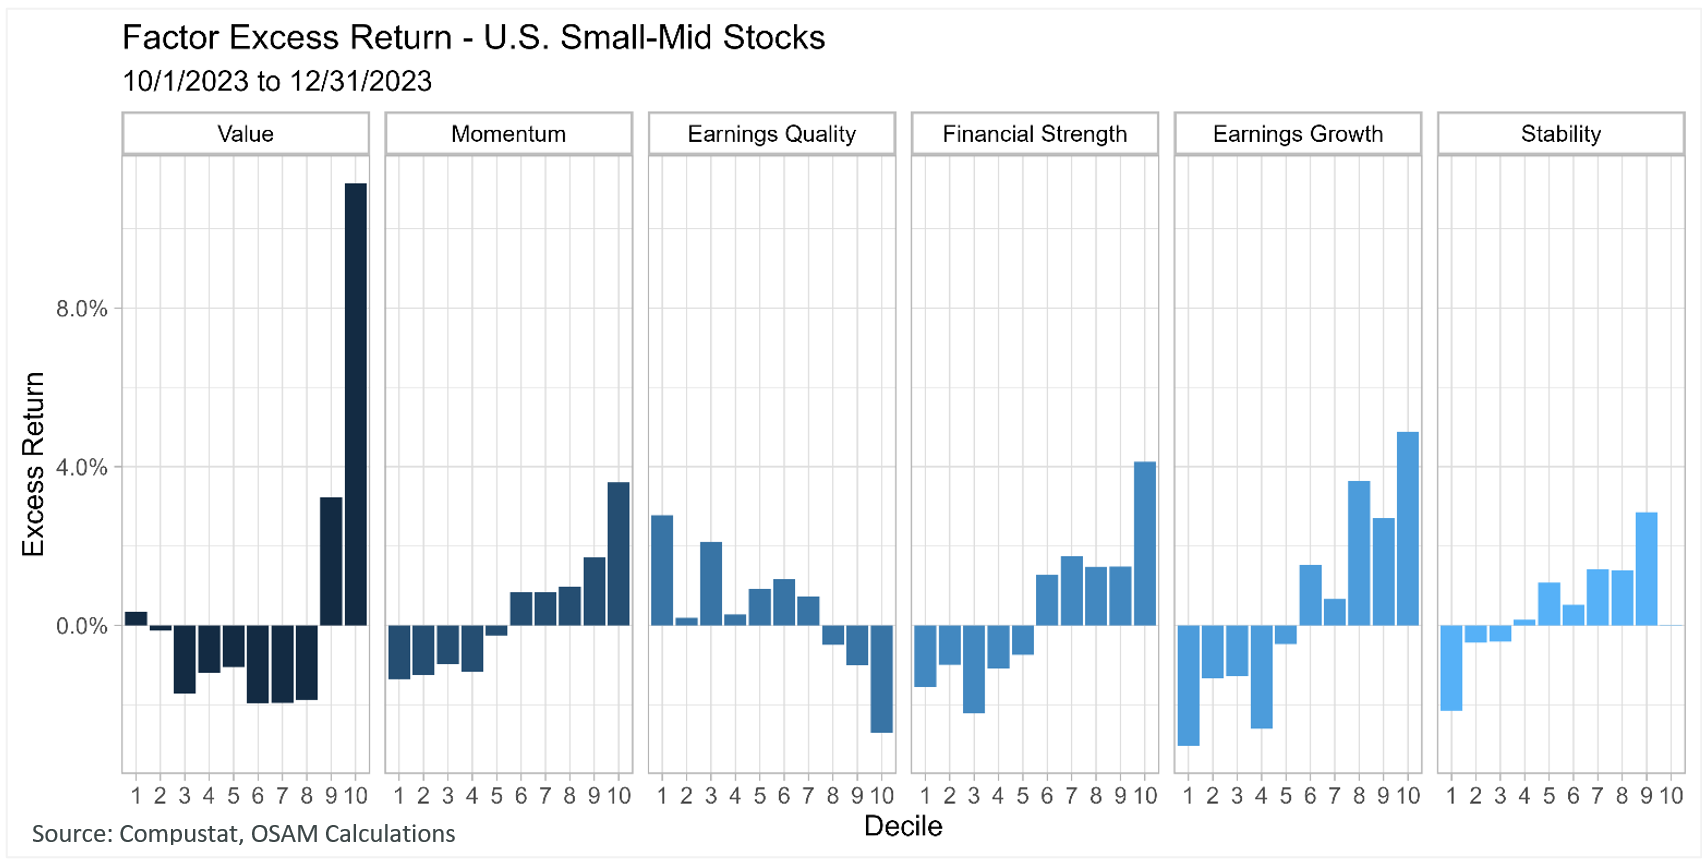
As we have highlighted in previous updates, the current macro regime likely favors tilts to quality and low volatility. Quality can be measured in multiple ways. We tend to measure it from three perspectives—Earnings Quality, Financial Strength, and Earnings Growth. We continue to favor Value and Shareholder Yield for active allocations on a longer-term basis as inflation dynamics and a steepening yield curve tend to be supportive of sectors that are overweight within those factors—Industrials, Energy, Materials, Financials.
Factor Performance
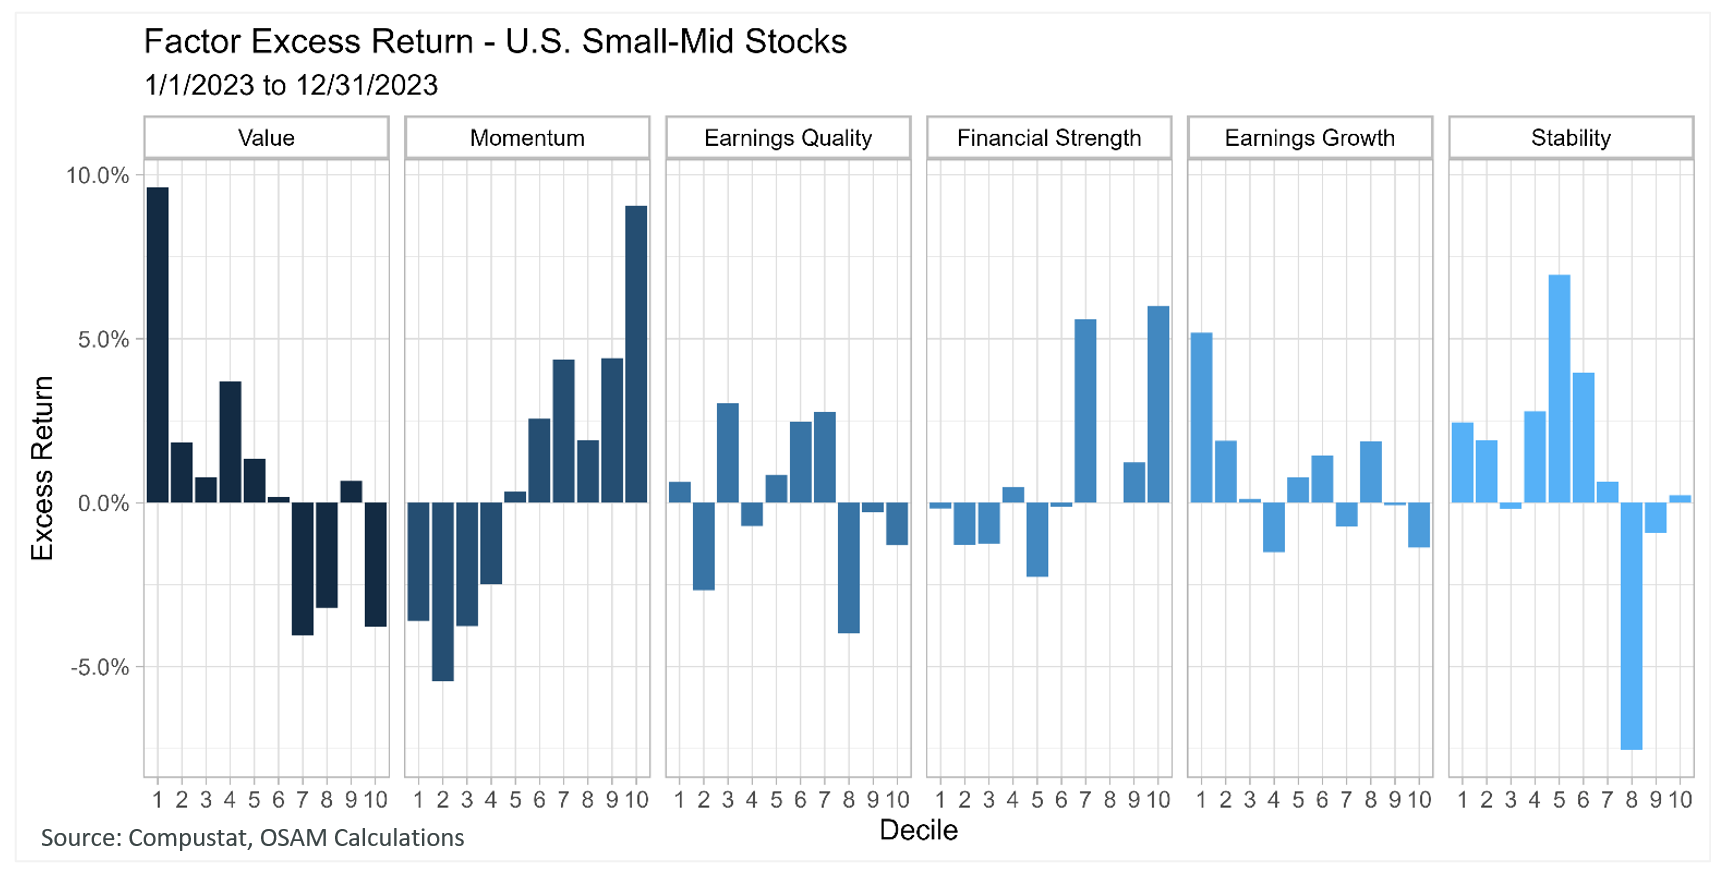
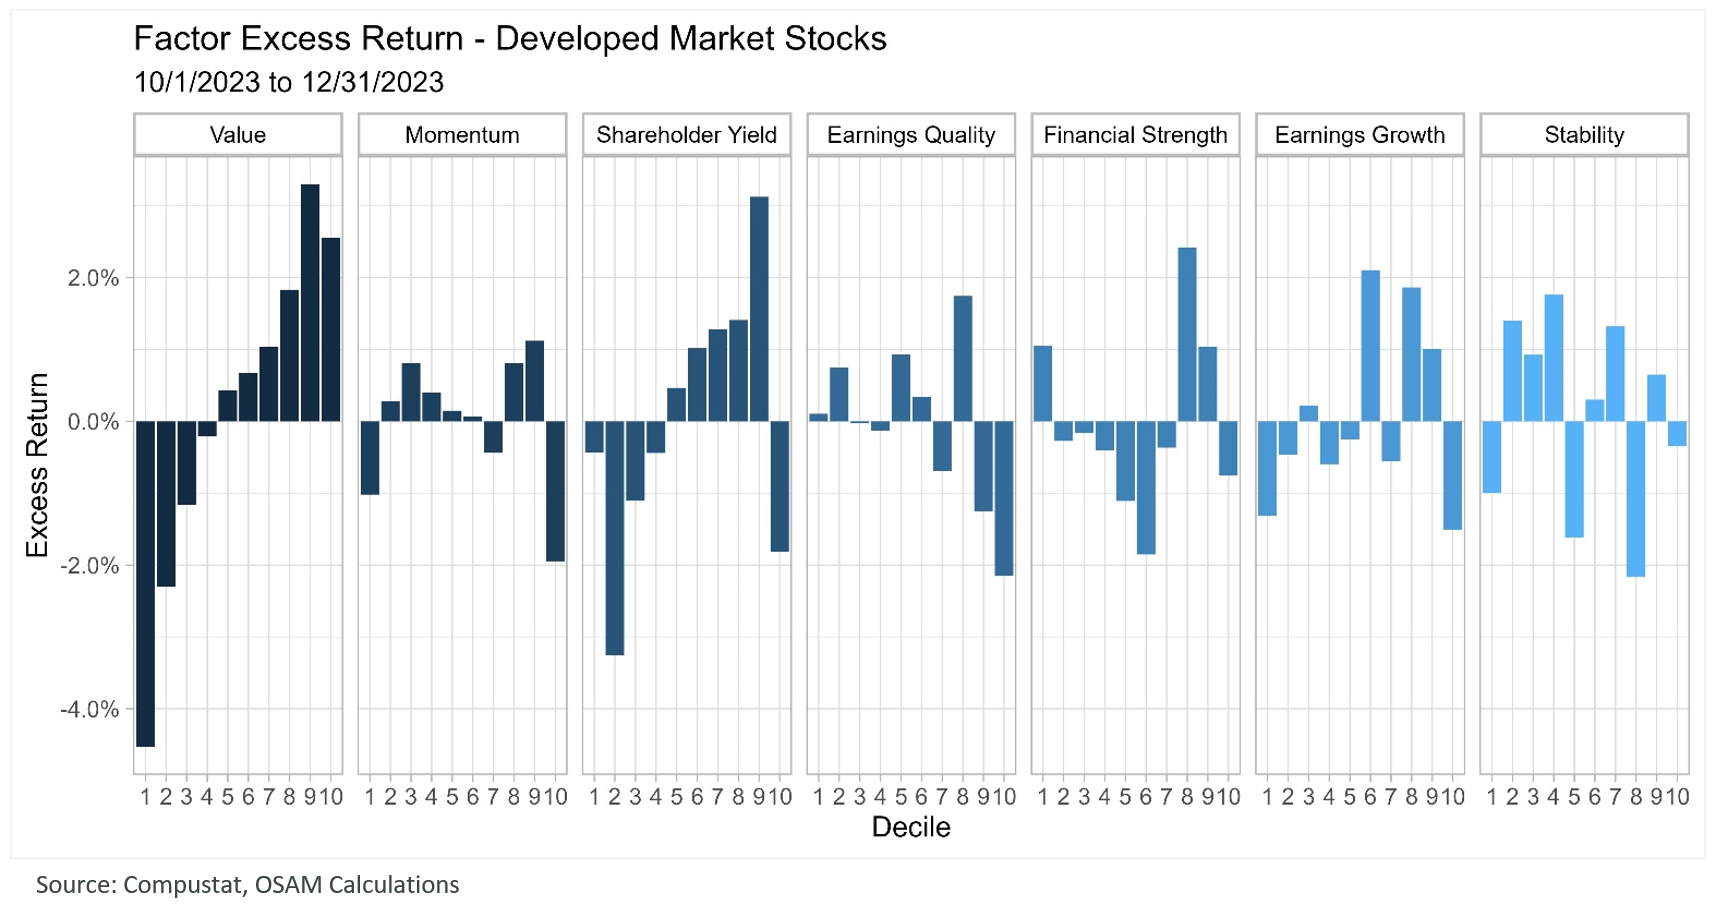
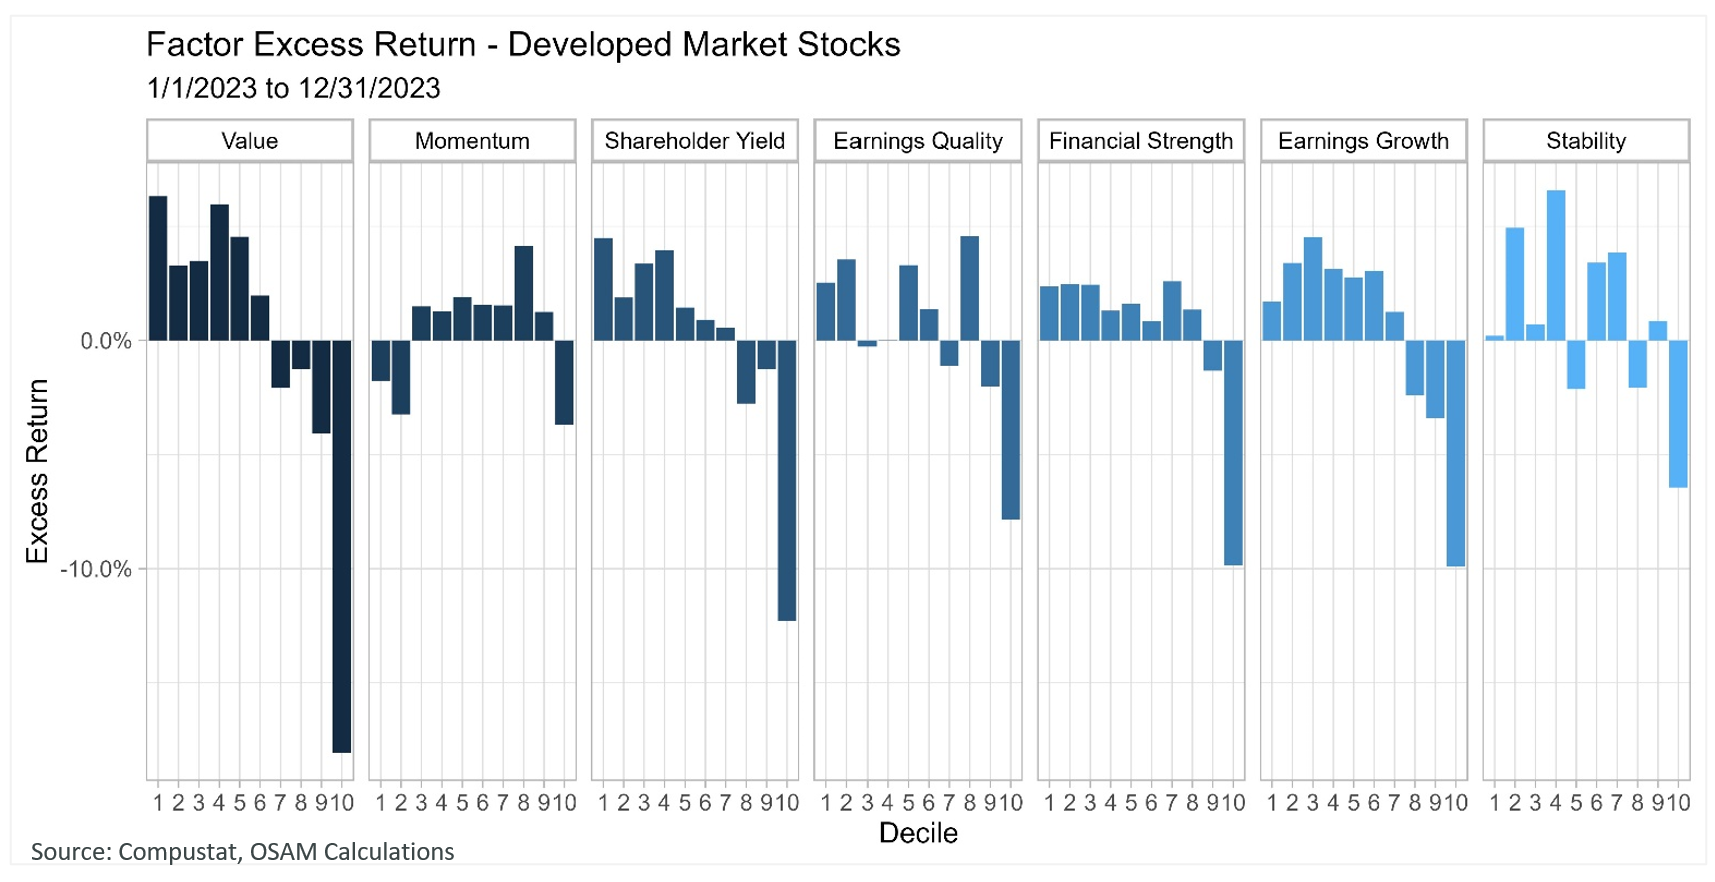
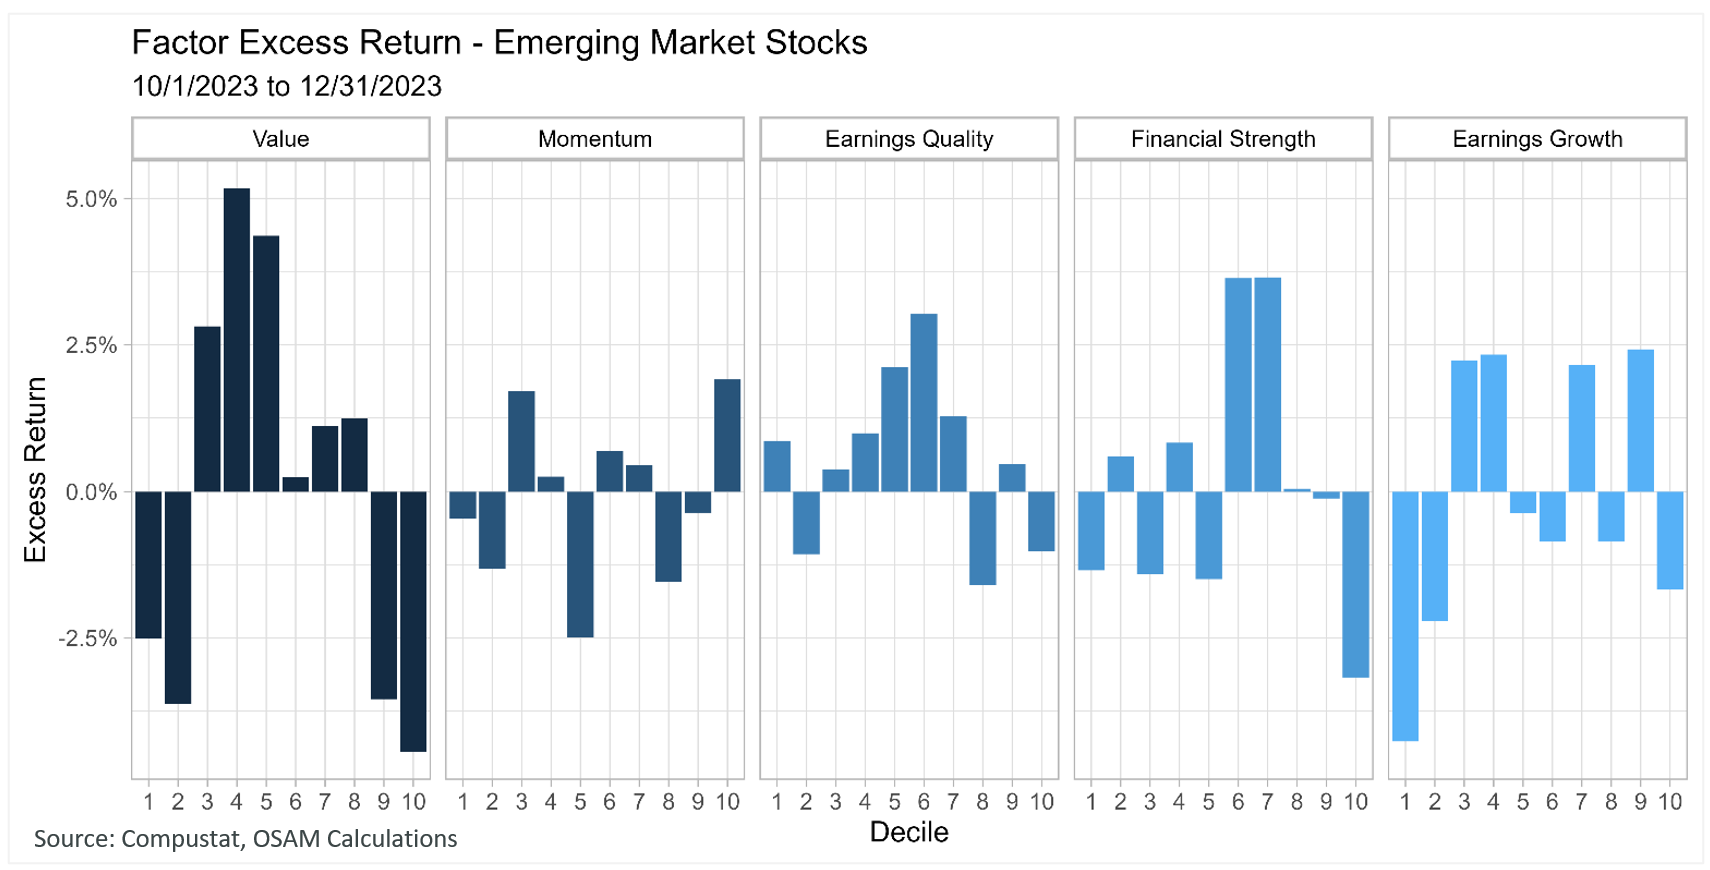
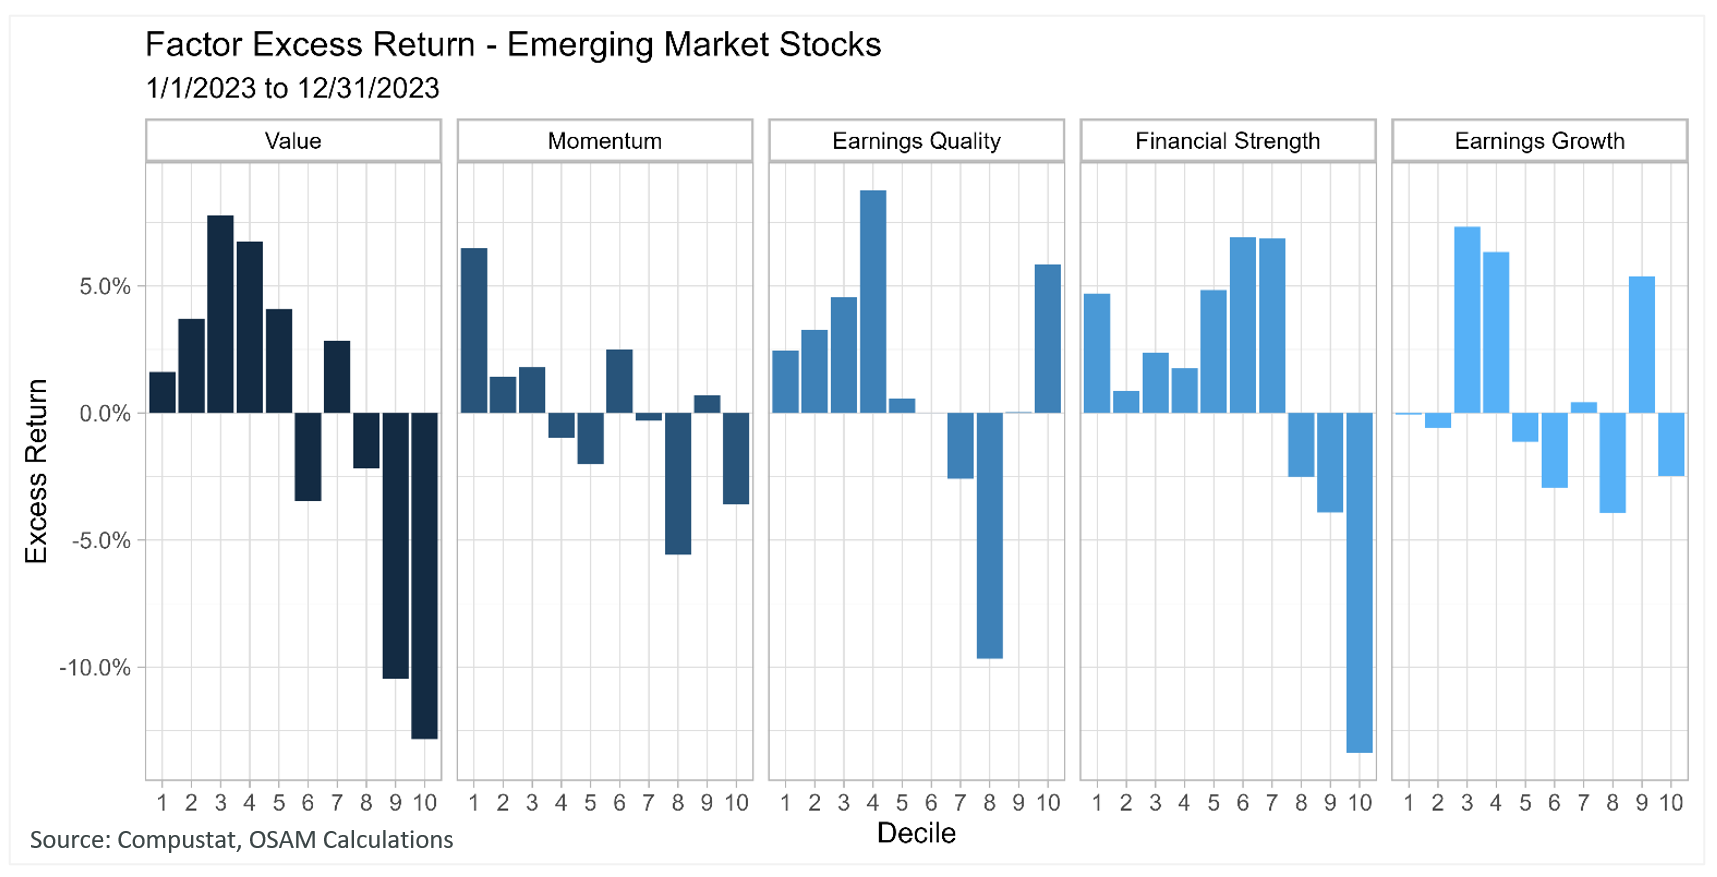
The charts below show the excess performance of the factor themes we monitor within each of our stock universes. We think of Value, Momentum, and Shareholder Yield as selection factors—helping identify stocks we want to own and overweight for generating total return. Earnings Quality, Financial Strength, and Earnings Growth are quality factors that allow us to avoid stocks with non-cash driven earnings, weak balance sheets, and questionable underlying businesses. Stability is a selection factor for identifying stocks that tend to exhibit lower volatility and historically provide improved downside capture during market drawdowns. Column 1 for each of the panels represents the highest-ranking stocks on each factor while column 10 shows the lowest ranking. Historically, owning the highest ranked stocks and avoiding the lowest ranked stocks has resulted in successful investment outcomes.
U.S. Large Stocks
U.S. Small-Mid Stocks
Developed Markets ADR All Stocks
Emerging Markets ADR All Stocks
Dividend Growth
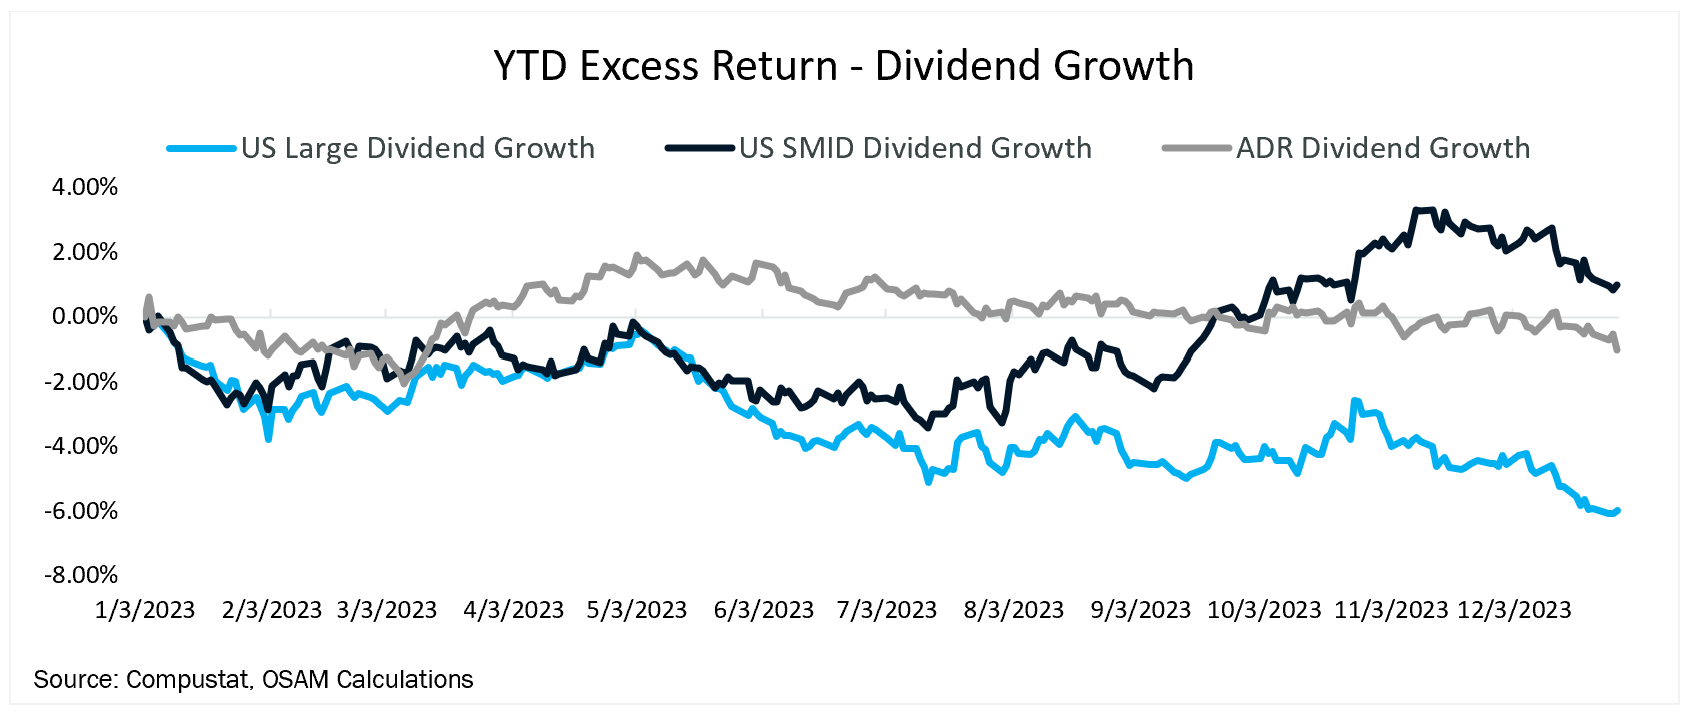
FOOTNOTES
1 The 2007-2008 global financial crisis stemming from sub-prime mortgage lending, otherwise known as ‘The Great Recession.’
2 A special purpose acquisition company (SPAC) is a company without commercial operations and is formed strictly to raise capital through an initial public offering.
3 A meme stock refers to the shares of a company that have gained viral popularity due to heightened social sentiment.
4 These were examples of tools used during and after World War II in the U.S. to ensure the industrial complex had funding, fuel, and materials to keep running.
5 MMT proposes that governments can freely spend without regard to revenues, with no ramifications from the monetization of deficits.
6 The Federal Open Market Committee (FOMC) makes key decisions about interest rates and the growth of the United States money supply.
7 The Federal Funds Rate is calculated as a volume-weighted median of overnight federal funds transactions. The Federal Open Market Committee establishes the target rate, or range, for trading in the federal funds market.
8 The Job Openings and Labor Turnover Survey (JOLTS) program produces data on job openings, hires, and separations.
9 This is not a forecast, but the result of analytical work done in our recent piece “Climbing the Maturity Wall of Worry” where we evaluated the EPS impact if prevailing rates stayed constant until 2030.
10 As of 12/27/2023.
11 Our analysis only focused on predictable debt maturities, not unforeseen exogenous credit events.
12 FRED. Annualized rate as of Q3 2023.
13 Bond vigilantes believed monetary and fiscal policy in the mid-1990s were inflationary and bet against them by selling bonds.
14 Oppenheimer. “The Long Good Buy”. Pg. 118.
15 The Magnificent Seven big tech stocks— Apple , Amazon , Alphabet , Meta Platforms , Microsoft , Nvidia , and Tesla.
16 S&P Global. S&P 500 Earnings and Estimate Report. 12/13/2023.
17 There is evidence that this is already occurring with S&P 500 non-financial corporate gross margins contracting 1.77% as a percentage of total sales since December 2021.
18 As of publication, Fed Fund Futures are pricing in a 150 bps decrease in the Fed Funds Target Rate by December 2024.
19 FRED, Price Indexes for Personal Consumption Expenditures by Major Type of Product, October 2023.
20 Earnings yield is the inverse of the P/E ratio.
21 Meredith, Chris. “Buybacks Bears and Bulls”.
22 Mauboussin, Michael. “Total Shareholder Return: Linking the Drives of Total Returns to Fundamentals”.
23 The methodology for comparing global equity markets on a per share, real, local currency basis was developed by Research Partner Jesse Livermore+.
O'SHAUGHNESSY ASSET MANAGEMENT, L.L.C. CANVAS® PLATFORM
IMPORTANT DISCLOSURE INFORMATION (revised as of March-2023)
CANVAS® is an interactive web-based investment tool developed by O’Shaughnessy Asset Management, L.L.C. (“OSAM”) that permits an investment professional (generally a registered investment advisor or a sophisticated investor) to select a desired investment strategy for the professional’s client. At all times, the investment professional, and not OSAM, is responsible for determining the initial and ongoing suitability of any investment strategy for the investment professional’s underlying client. The professional’s client shall not rely on OSAM for any such initial or subsequent review or determination. Rather, to the contrary, at all times the professional shall remain exclusively responsible for same. See MORE ABOUT CANVAS below and Release and Hold Harmless at the end of this Important Disclosure Information.
Reliance on Investment Professional: OSAM has relied, and shall continue to rely, on the investment professional’s knowledge and experience to understand the inherent limitations of the performance presentation, including those pertaining to back-tested hypothetical performance. All performance presentations, including hypothetical performance, are the direct result of the investment professional’s request, independent of OSAM. Depending upon the investment professional’s direction and selection, hypothetical presentations can include both OSAM and non-OSAM Models and/or strategies. The below discussion as to the material limitations of back-tested hypotheticals apply to both OSAM and non-OSAM Models and/or strategies.
Intended Recipient: CANVAS content is intended for the investment professional only not to be shared with an underlying client unless in conjunction with a meeting between the investment professional and its client in a one-on-one setting. OSAM assumes that no hypothetical performance-related content will be provided directly to the professional’s client without the accompanying consultation and explanation of the professional. The content is intended to assist the professional in evaluating the appropriate investment strategy for the professional’s client.
OSAM Models: OSAM has devised various investment models (the “Models”) for CANVAS, the objectives of each are described herein. The investment professional is not obligated to consider or utilize any of the Models. As indicated above, at all times, the investment professional, and not OSAM, is responsible for determining the initial and ongoing suitability of any Model for the investment professional’s underlying client. Model performance reflects the reinvestment of dividends and other account earnings and are presented both net of the maximum OSAM’s investment management fee for the selected strategy and gross of an OSAM investment management fee. Please Note: As indicated at Item 5 of its written disclosure Brochure, OSAM’s CANVAS management fee ranges from 0.20% to 1.15%. The average percentage management fee for all CANVAS strategies is 0.29%. The percentage OSAM management fee shall depend upon the type of strategy and the corresponding amount of assets invested in the strategy; generally, the greater the amount of assets, the lower the percentage management fee. Please Also Note: The performance also do not reflect deduction of transaction and/or custodial fees (to the extent applicable), the incurrence of which would further decrease the performance. For example, if reviewing a strategy with a ten-year return of 10.0% each year, the effect of a 0.10% transaction/custodial fee would reduce the reflected cumulative returns from 10.0% to 9.9% on a 1 year basis, 33.1% to 32.7% on a 3 year basis, 61.1% to 60.3% on a 5 year basis and 159.4% to 156.8% on a 10 year basis respectively. Please Further Note: Transaction/custodial fees will differ depending upon the account broker-dealer/custodian utilized. While some broker-dealers/custodians do not charge transaction fees for individual equity (including ETF) transactions, others do. Some custodians charge fixed fees for custody and execution services. Choice of custodian is determined by the investment professional and his/her/its client. Higher fees will adversely impact account performance.
OSAM does not maintain actual historical performance results for the Models. In order to help assist the investment professional in determining whether a Model is appropriate for the professional’s client, OSAM has provided back-tested hypothetical (i.e., not actual) performance for the Model. OSAM, with minor deviations that it does not consider to be material*, currently uses the Models (i.e., live models vs. the reflected back-tested versions thereof) to manage actual client portfolios (see Model Deviations below). The performance reflects the current Model holdings, which are subject to ongoing change.
Material Limitations: The Performance is subject to material limitations. Please see Hypothetical/Material Limitations below. During any specific point in time or time-period, the Models, as currently comprised, performed better or worse, with more or less volatility, than corresponding recognized comparative indices, benchmarks or blends thereof.
Past performance may not be indicative of future results. Therefore, it should not be assumed that future performance of any specific investment or investment strategy (including the Models), will be profitable, equal any historical index or blended index performance level(s), or prove successful. Historical index results do not reflect the deduction of transaction and custodial charges, or the deduction of an investment management fee, the incurrence of which would have the effect of decreasing indicated historical performance results. The Russell 3000 is a market capitalization-weighted index of 3000 widely held large, mid, and small cap stocks. Russell chooses the member companies for the Russell 3000 based on market size and liquidity. The MSCI All Country World Index is a market capitalization weighted index designed to provide a broad measure of equity-market performance throughout the world. The MSCI is maintained by Morgan Stanley Capital International and is comprised of stocks from 23 developed countries and 24 emerging markets. The Barclays Capital Aggregate Bond Index is a market capitalization-weighted index, meaning the securities in the index are weighted according to the market size of each bond type. Most U.S. traded investment grade bonds are represented. Municipal bonds and Treasury Inflation-Protected Securities are excluded, due to tax treatment issues. The index includes Treasury securities, Government agency bonds, Mortgage-backed bonds, corporate bonds, and a small amount of foreign bonds traded in U.S. The historical performance results for the Russell 3000, MSCI and Barclays are provided exclusively for comparison purposes only, to provide general comparative information to help assist in determining whether a Model or other type strategy (relative to the reflected indices) is appropriate for his/her investment objective and risk tolerance. Please Also Note: (1) Performance does not reflect the impact of client-incurred taxes; (2) Neither Model or the selected strategy holdings correspond directly to any such comparative index; and (3) comparative indices may be more or less volatile than the Model or selected strategy.
Hypothetical/Material Limitations: Performance reflects hypothetical back-tested results that were achieved by means of the retroactive application of a back-tested portfolio and, as such, the corresponding results have inherent limitations, including: (a) the performance results do not reflect the results of actual trading using investor assets, but were achieved by means of the retroactive application of the Model or strategy (as currently comprised), aspects of which may have been designed with the benefit of hindsight; (b) back tested performance may not reflect the impact that any material market or economic factors might have had on OSAM’s (or the investment professional’s) investment decisions for the Model or the strategy; and, correspondingly; (c) had OSAM used the Model to manage actual client assets (or had the investment professional used the selected strategy to manage actual client assets) during the corresponding time periods, actual performance results could have been materially different for various reasons including variances in the investment management fee incurred, transaction dates, rebalancing dates (increases account turnover), market fluctuation, tax considerations (including tax-loss harvesting-increases account turnover), and the date on which a client engaged OSAM’s investment management services.
MORE ABOUT CANVAS®
CANVAS is an interactive web-based investment tool developed by O’Shaughnessy Asset Management, L.L.C. (“OSAM”) that permits an investment professional (generally a registered investment advisor or a sophisticated investor) to select a desired investment strategy (the “Strategy”) for the professional’s client. At all times, the investment professional, and not OSAM, is responsible maintaining the initial and ongoing relationship with the underlying client and rendering individualized investment advice to the client. In addition, the investment professional and not OSAM, is exclusively responsible for:
- determining the initial and ongoing suitability of the Strategy for the client;
- devising or determining the specific initial and ongoing desired Strategy;
- monitoring performance of the Strategy; and,
- modifying and/or terminating the management of the client’s account using the Strategy.
Hypothetical Limitations: To the extent that the investment professional seeks for CANVAS to provide hypothetical back-tested performance, material limitations apply-see above.
Model Deviations: As indicated above, OSAM, with minor deviations that it does not consider to be material*, currently use the Models to manage actual client portfolios (i.e., the live Models). The deviations include:
- the use of proxies if and when an ETF used in the back-test was not available*. While the back-tested and live strategies both utilize the same investment themes, back-tested proxies can deviate from live models based on limitations of historical information;
- back-tested data presented utilizes a month-end rebalance while actual live model performance reflects intra-month rebalances;
- OSAM, as a discretionary manager, can update its live models as determined necessary. These changes will then be applied retroactively to back-tested models, the resulting performance of which would be different than that of the actual historical models-see Hypothetical/Material Limitations above; and,
- Financial statement information may be restated over time, which information was not reflected in the historical back-tested models. Companies will also have mergers and acquisitions or other corporate events that can retrospectively affect the names and corporate identities of organizations in the historical back-tests. Data providers providing pricing and return information may update historical data upon discovering deficiencies or omissions.
Strategy Sampling Impact: The implementation of OSAM strategies utilize a sampling of the underlying individual Strategy positions, and, as the result thereof, the underlying securities’ weighting could unintentionally deviate +/- the Strategy allocation target OSAM calculates the CANVAS fees based on the mix of strategies that are utilized at the establishment of the account. Therefore, the sampling approach can cause deviations between the CANVAS strategy allocation establishment (and its corresponding fee) and the implementation of that CANVAS strategy.
ESG Portfolios/Socially Responsible Investing Limitations: To the extent applicable to the strategy chosen by the investment professional, Socially Responsible Investing involves the incorporation of Environmental, Social and Governance considerations into the investment due diligence process (“ESG). There are potential limitations associated with allocating a portion of an investment portfolio in ESG securities (i.e., securities that have a mandate to avoid, when possible, investments in such products as alcohol, tobacco, firearms, oil drilling, gambling, etc.). The number of these securities may be limited when compared to those that do not maintain such a mandate. ESG securities could underperform broad market indices. Investors must accept these limitations, including potential for underperformance. Correspondingly, the number of ESG mutual funds and exchange-traded funds are few when compared to those that do not maintain such a mandate. As with any type of investment (including any investment and/or investment strategies recommended and/or undertaken by OSAM), there can be no assurance that investment in ESG securities or funds will be profitable or prove successful.
Tax Management Function: When requested by the investment professional, OSAM will use best efforts to work within Onboarding Budgets, Annual Tax Budgets, and Tracking Error Budgets. However, market and/or specific stock price fluctuations can occur quickly and can correspondingly adversely affect our ability to manage to specified budgets. Additionally, changes to tax budgets, cash flows in and out of an account, mandatory corporate actions, and funding with securities can also impact preciseness. The investment professional must accept this risk. In addition:
- OSAM has not, and will not, verify the accuracy of any tax-related information provided;
- In the event that any such information provided is inaccurate or incomplete, the corresponding results will be inaccurate or incomplete;
- Tracking Error Budgets are relative to the Model, not the benchmark;
- OSAM is not a CPA and this is not tax advice;
- Tax laws and rates change;
- While we seek to follow investment professional prescribed target models, ranges, timeframes, tax budgets, and seek not to create wash sales or exceed expected tax budgets, there can be no assurance that the CANVAS tool will be able to accurately do so; and,
- For specific personalized tax-related advice, consult with a CPA or other tax professional.
Fixed Income ETF Model: The models are constructed using passive fixed income ETFs. The models attempt to target varying levels of duration and credit exposure relative to the Barclays Aggregate Index. The expense ratios of the underlying ETF’s are born by the investor and are separate and apart from CANVAS related fees.
Miscellaneous Limitations/Issues:
- Results in the Transition Portal reflect expense ratios corresponding to the specific funds indicated/provided by the investment professional. Expense ratios are provided by an unaffiliated database. Results also reflect projected future yields corresponding to such current indicated funds. Such data may not be precise;
- The risk-free rate used in the calculation of Sortino, Sharpe, and Treynor ratios is 5%, consistently applied across time;
- OSAM did not begin to offer CANVAS until April 2019. Prior to 2007, OSAM did not manage client assets; and,
- A copy of OSAM’s written disclosure Brochure, Form CRS and Privacy Notice remains available on this CANVAS website or at www.osam.com.
Release and Hold Harmless
The professional, to the fullest extent permitted under applicable law, agrees to release, defend, indemnify and hold OSAM (including its officers, directors, members, owners, employees, agents, and affiliates) harmless from any and all adverse consequences, financial or otherwise, of any type or nature arising from or attributable to the professional’s access to, and use of, CANVAS, including, but not limited to, any claims for alleged or actual client losses or damages of any kind or nature whatsoever (including without limitation, the reimbursement of reasonable attorney’s fees, costs and expenses incurred by OSAM relating to investigating or defending any such claims and/or demands), except to the extent that actual losses are the direct result of an act or omission by OSAM that constitutes willful misfeasance, bad faith or gross negligence as adjudged by a court of final jurisdiction.
*except in the unlikely event that the performance of the proxy used in lieu of the actual ETF was materially different (positive or negative)
Lastly, please be advised, without limitation, OSAM shall not be liable for Losses resulting from or in any way arising out of (i) any action of the investor or its previous advisers or other agents, (ii) force majeure or other events beyond the control of OSAM, including without limitation any failure, default or delay in performance resulting from computer or other electronic or mechanical equipment failure, unauthorized access, strikes, failure of common carrier or utility systems, severe weather or breakdown in communications not reasonably within the control of OSAM, inaccuracy or incompleteness of any third-party data, or other causes commonly known as “acts of God,” or (iii) general market conditions. Under no circumstances shall OSAM be liable for consequential, special, incidental or indirect damages, punitive damages, or lost profits or reputational harm. Additionally, to the extent applicable, the responsibility solely rests on the “master user” of CANVAS at each independent firm, and NOT OSAM, to close out any associated users who may terminate at any time.
Please Note: Projection/Assumption Limitations. To the extent that any portion of the content reflects assumptions and/or projections, no such content should be construed or relied upon as an absolute probability that such an assumption or projection will prove correct or projected result will occur. To the contrary, a different result (positive or negative) can, and most likely will, occur. Materially different results could occur at any specific point in time or over any specific time period. The purpose of the projections is to provide a guideline to help determine which scenario best meets current and/or anticipated financial situations and/or objectives.
Please Note: Limitations: The accuracy of the Tracking Error is co-dependent upon corresponding client-designated constraints. Depending upon nature and extent of the constraints, the results may not correspond to the tracking error.
Please Note: Potential Conflict. OSAM is wholly owned by Franklin Resources, Inc., d/b/a Franklin Templeton. CANVAS could include funds and/or managers affiliated with and/or recommended by Franklin Templeton, as the result of which OSAM’s parent (Franklin) could derive additional compensation.
Please Note: Limitations. There can be no assurance, nor should there be any expectation, that OSAM shall act on any direction, instruction and/or notice on the day it is received.
Where applicable and used in investment offering: S&P 500® (a registered trademark of S&P® Global or its affiliates, an affiliate and third-party licensor of S&P®), S&P MidCap 400® (also known as the S&P 400® index, a registered trademark of S&P® Global or its affiliates, an affiliate and third-party licensor of S&P®), S&P SmallCap 600® (also known as the S&P 600® index, a registered trademark of S&P® Global or its affiliates, an affiliate and third-party licensor of S&P®), S&P Composite 1500® (also known as the S&P 1500® index, a registered trademark of S&P® Global or its affiliates, an affiliate and third-party licensor of S&P®), S&P® Global BMI, S&P® ADR, S&P®/TSX® Composite (S&P® a registered trademark of S&P® Global or its affiliates, an affiliate and third-party licensor of S&P®, and TSX® a registered trademark of TSX®, Inc., a third-party licensor of S&P®) are products of S&P® Dow Jones® Indices LLC or its affiliates (“SPDJI”) and have been licensed for use by Franklin Templeton, of which OSAM is a wholly owned subsidiary. Standard & Poor’s® and S&P® are registered trademarks of Standard & Poor’s Financial Services LLC (“S&P®”); Dow Jones® is a registered trademark of Dow Jones® Trademark Holdings LLC (“Dow Jones®”); and these trademarks have been licensed for use by SPDJI and sublicensed for certain purposes by Franklin Templeton. S&P 500®, S&P MidCap 400® (also known as the S&P 400® index), S&P SmallCap 600® (also known as the S&P 600® index), S&P Composite 1500® (also known as the S&P 1500® index), S&P® Global BMI, S&P® ADR, S&P®/TSX® Composite are not sponsored, endorsed, sold or promoted by SPDJI, Dow Jones®, S&P®, their respective affiliates, and none of such parties make any representation regarding the advisability of investing in such product(s) nor do they have any liability for any errors, omissions, or interruptions of the previously disclosed Indices above.
Additionally, please note, where applicable, funds and/or strategies have been developed solely by OSAM or FRI. The funds and/or strategies are not in any way connected to or sponsored, endorsed, sold or promoted by the London Stock Exchange Group plc and its group undertakings (collectively, the “LSE Group”). FTSE Russell is a trading name of certain of the LSE Group companies. All rights in the “FTSE Russell Index” (the “Index”) vest in the relevant LSE Group company which owns the Index. “FTSE®” “Russell®”, “FTSE Russell®”, “FTSE4Good®”, “ICB®”, and/or “The Yield Book®,” are a trademark(s) of the relevant LSE Group company and are used by any other LSE Group company under license. The Index is calculated by or on behalf of FTSE International Limited, FTSE Fixed Income, LLC, and/or its affiliate, agent, or partner. The LSE Group does not accept any liability whatsoever to any person arising out of (a) the use of, reliance on, or any error in the Index or (b) investment in or operation of the funds and/or strategies. The LSE Group makes no claim, prediction, warranty, or representation either as to the results to be obtained from the funds and/or strategies or the suitability of the Index for the purpose to which it is being put by OSAM or FRI.
Lastly, please note, where applicable, certain funds and/or strategies described herein are indexed to an MSCI index. In addition, MSCI hereby grants to Licensee a temporary, non-sublicensable (except as provided in its Agreement with OSAM), a non-transferable, non-exclusive license to hyperlink to MSCI’s website, www.msci.com, from any Licensee web page containing MSCI data or information. Further, Licensee hereby grants MSCI a temporary non-sub licensable, non-transferable, non-exclusive license to list Licensee as a licensee of MSCI data and to hyperlink to Licensee's website. For the avoidance of doubt, nothing herein shall confer any rights to MSCI in the Informational Materials where the Marks and MSCI logos may appear. Each of these licenses may be revoked at any time by MSCI or Licensee without notice without affecting any of the other rights granted hereunder.
O’Shaughnessy Asset Management, LLC (OSAM) is wholly owned subsidiary of Franklin Resources Inc./(Franklin Templeton).